Like tens of millions of Americans, I was shopping this weekend – out there in “brick and mortar” stores, no less. You know – the same retailers that are said to be heading the way of the dinosaur while they drag down the wider stock market at this time of year.
Well, while I did see a genius driving with one hand on the wheel and another desperately clutching the new 65″ flat-screen television he was holding to the roof of his car, I didn’t see much to convince me that real-world stores were going to mount much of a comeback challenge to the increasing dominance of online “e-tailers.”
But… my trip did bring to light a significant disconnect between Wall Street’s perception of retail and what actually happens in the real world.
That’s not going to help J.C. Penney Co. Inc. (NYSE: JCP) or Wal-Mart Stores Inc. (NYSE: WMT), but that gulf is something we can use to make some seasonal spending money – if we get started today. Here’s what I mean…
My Charts Reveal a Reliable Pattern
I’m a data fanatic. I love sifting through charts packed with numbers to set up my next winning trade.
And because I like a high certainty of winning, what I look for most in the data are pricing and time patterns that repeat again and again.
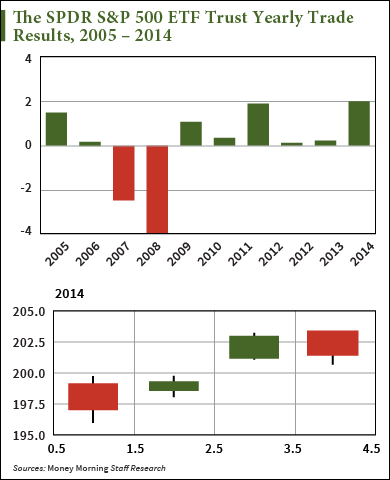
So fresh from my Black Friday expedition, I looked at the charts for the S&P 500 in the week after the Thanksgiving holiday.
I found that, despite the seasonal angst about stocks out there among pundits, over the last 10 years, 70% of the time the S&P 500, as tracked by the SPDR S&P 500 ETF Trust (NYSE Arca: SPY), moved higher in the week following Thanksgiving.
In fact, like “A Charlie Brown Thanksgiving,” this pattern repeats itself at the exact same time each year.

Over the last 10 years, the week after Thanksgiving gave the SPY over 276 cumulative points.


Leave A Comment