Inflation! Deflation!
Two words that strike fear into the hearts of investors.
Are such fears justified? Let’s take a look…
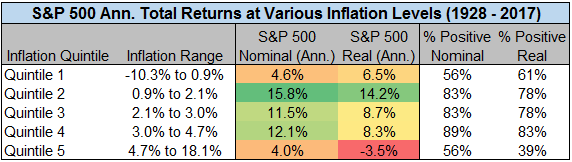
If we segment calendar year changes in the Consumer Price Index (CPI) into quintiles, we observe the following:

Source Data for all tables herein: YCharts, BLS, Stern.NYU.edu/~adamodar
During years with the highest inflation (quintile 5):

During years with the lowest inflation (quintile 1):

What’s left? The so-called “goldilocks” periods in which inflation was running neither too cold nor too hot (in a range between 1.2% and 4.7%). It was during these quintiles that stocks posted their best returns on both a nominal and real basis.

Related Posts
 New York Is The 9th Most Expensive City In The World – Singapore Ranks No.1
- U.K. Services Sector Slows In April; Pound Dips
 ECRI Weekly Leading Index Update
 S&P 500 Adam And Adam Double Bottom Pattern In Progress
 Did President Obama Seal The ‘No’ Vote On The Renzi Referendum?
 BTC/USD And BTC/JPY Forecast – Tuesday, April 3


Leave A Comment