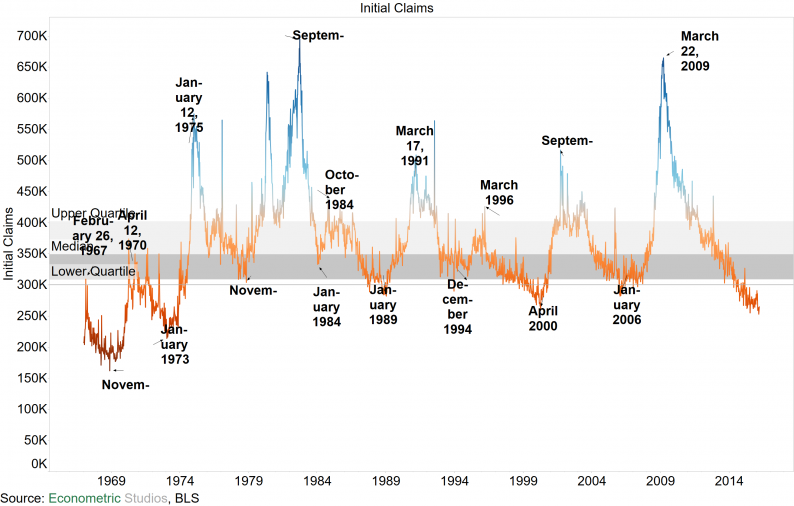
Initial Claims came in at +265K, making it over a year of Initial Claims below the psychologically important 300K threshold. In looking at comparable cycles, one has to go all the way back to the early 1970s to find a similar instance.
This isn’t your typical tech bubble. Nor is it your typical housing bubble. This is something else.
Perhaps call it the Fed bubble. Or the online work bubble. Call it whatever you’d like, but this labor market is something more than the tech and housing bubbles.


Claims per Employee
The broad Initial Claims picture is one way to view the figures.Dividing by how many employees there are is another.
Here’s a look at Initial Claims per Non-Farm Employee, as measured by the employer survey.
The most recent data point of 1.82 is by far the lowest on record.
In the tech bubble of early 2000, Claims per Employee bottomed at 2.06 in April 2000.
In the housing boom of 2006, Claims per Employee bottomed at 2.14 in February 2006.
The end of the very long 1980s boom saw Claims per Employee bottom out at 2.70 in January 1989.
This all points to the amazing renaissance the U.S. labor market is going through. Just amazing.

Claims per Labor Force
The actual figure and the per employee pictures are two ways of viewing the American labor picture. A third way is to divide by the total labor force.
This paints a very similar picture. Claims per individual in the labor force are at an all-time low of 1.64. The rosy picture is almost unbelievable.
With almost certainty, there’s a structural shift going on with the American labor market. Individuals have less of an interest in working, while claims suggest individuals are very rarely being laid off.
Triggers behind the new normal might be the ongoing shift to online work, the sharing economy, demographic changes, international competition for labor, and a host of other issues.

Claims with Durable Orders

Related Posts
 Thoughts On The ECB Minutes And A Bearish Euro Call For EUR/USD Bulls
 Sangamo Therapeutics – Chart Of The Day
 More Price Action From This Market
 E
Before You Invest, Ask Yourself These 3 Crucial Questions
E
Before You Invest, Ask Yourself These 3 Crucial Questions Valeant, Ackman Settle Insider Trading Lawsuit For $290 Million
 Chart Of The Day: Direxion Daily Gold Miners Bear 3X ETF


Leave A Comment