Two important financial cycles are currently converging for the first time in more than ten years, and how they work in combination can provide key information about the future value of our retirement portfolios, the future prices of our homes, and even when the next recession may hit.
A continuing cycle of interest rate increases by the Federal Reserve has pushed Fed Funds rates up 2% from their floor. This same cycle has contributed to rapidly rising long-term interest rates, with 10 year Treasury yields rising to 3.22% by the market close on October 5th, 2018.
This sharp surge in interest rates has led not only to falling bond prices but to tumbling stock prices as well.
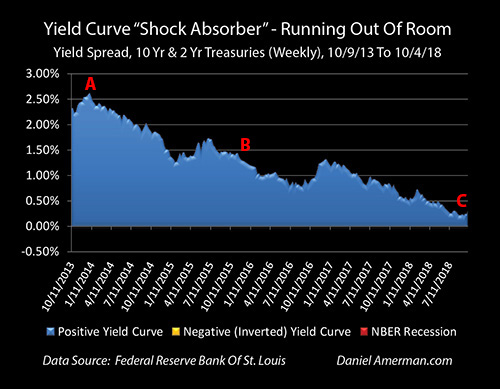
Until recently however, an offsetting cycle has been at least partially shielding the value of many assets – including home values and REIT values – from the Fed’s increasing interest rate cycle. There has been a “shock absorber” in place, as shown in the blue area below.

The compression of the yield curve (the difference between short term and long term interest rates) is an offsetting cycle, which historically shields consumers and markets from the full effects of the Fed increasing short-term interest rates – until it doesn’t. There used to be a large shock absorber in place, as identified with the red letters “A” and “B” above, but as can be seen with the letter “C” – that shock absorber has been almost entirely used up.
What has been happening is that because there used to be a great deal of room between short-term interest rates and long-term interest rates, the markets could absorb much or most of the negative impact of the Fed’s ongoing short-term rate increases, and not pass through the full effects to long-term bond yields or mortgage rates.

There is, however, a particular problem with using up the rest of the very thin shock absorber that remains. That part of the cycle has indeed occurred a number of times before, and the result each time has been the golden areas of “yield curve inversions” above, when short-term interest rates become higher than long-term interest rates.
These quite uncommon cyclical inversions have then (with remarkable consistency) been followed shortly thereafter by the red areas of recessions. (An in-depth analysis of the historical relationship between yield curve inversions and recessions is linked here.)
This leaves the markets – and homeowners – between “a rock and a hard place”. Assuming the Fed continues to increase interest rates, then either:
1) The shock absorber stops absorbing the damage, and further anticipated Fed rate increases go full force from here forward into reducing not only bond prices, but also possibly stock prices and home values as well; or
2) The shock absorber uses up the last of its power, there is a yield curve inversion, and history shows there is then a very high chance that a recession will occur in the next 1-2 years.
This analysis is part of a series of related analyses, an overview of the rest of the series is linked here.
Changes In Yield Curve Spreads
The graph below shows three interest rates on a weekly basis between October of 2013 and early October of 2018, with effective Fed Funds rates being shown on bottom in yellow, 2 year Treasury yields in red, and 10 year Treasury yields on top in green. The normal situation for the markets is that long-term interest rates are higher than short-term interest rates, and for each week shown, 10-year yields are indeed higher than 2-year yields, which are in turn higher than the overnight Fed Funds interest rates.

Related Posts
 What is Mimblewimble and how does it work?
 Mideast And US Hold On To Only Regional Equity Gains This Year
- UPS, FedEx Sink As Bezos Launches “Shipping With Amazon”
- Gold Juniors’ Q2’18 Fundamentals
 Cardinal Health (CAH) Tops Q3 Earnings, Miss On Revenues
 Turkey Approaching The Point Of No Return As Erdogan Blames The Currency Decline On USA


Leave A Comment