
Without a doubt, U.S. equity market returns have been exceptional this year, specifically for mega cap stocks. The year-to-date return for the capitalization weighted S&P 500 Index is 20.8% through the end of November. It is true more the half of the S&P 500 stocks have generated a positive total return this year, 300 to be exact, however, the return contribution to the S&P 500 Index’s overall return is dominated by the so-called Magnificent Seven stocks, listed below. Due to the cap weighted nature of the return calculation, i.e., larger market cap companies contribute more to the index’s return, the Index has generated strong returns. As the below table shows the seven largest stocks in the index account for 71.58% of the 20.8% YTD return.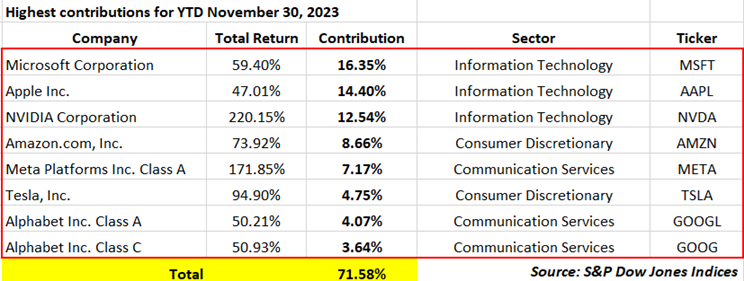 With equity market returns concentrated in a few mega cap stocks, one might find investment opportunities in other asset classes. As the below bar chart shows, other asset class returns have lagged behind the large cap S&P 500 Index. The green bars represent U.S. indexes while the blue bars consist of either all foreign stock indexes or a combination of U.S. and international stocks. The Invesco S&P 500 equal Weight ETF (RSP) consists of the stocks in the S&P 500 Index, but each of the index’s stocks is equally weighted. In short, the YTD return of 6.4% represents the average return of a stock in the Index, far lower than the S&P 500 Index return of 20.8%.
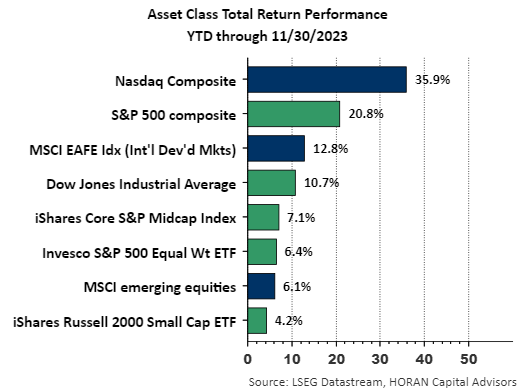 With the calendar now entering the month of December and year-end fast approaching, a favorable seasonal period lies ahead for the market. The favorable period actually began in November with almost half of the year-to-date return for the S&P 500 Index occurring in November, up 9.13%. The tailwind in November was partly attributable to expectations the Fed is done raising short-term interest rates. Also, with the third quarter 2023 earnings season coming to an end, company results have come in better than expected. Refinitiv notes in their This Week in Earnings report, that 82% of the 490 companies in the S&P 500 Index that have reported earnings exceeded analyst expectations. The long-term average beat rate is 66.5%. For December, as noted by Sam Stovall, CFRA Chief Investment Strategist,“If history is any guide, for it’s never gospel, chances favor a gain, since the S&P 500 recorded more positive returns in December than in any other month of the year since WWII. Since 1945, while the S&P 500 posted the third highest average monthly return in December, the month stands atop the frequency of advance pile, rising in price 76% of the time…we see that the financials, industrials, and utilities sectors posted the highest frequencies of advance, while energy, materials, and information technology recorded the lowest”With the odds favoring a positive December, this leads to the January Effect, which begins in mid-December. Especially favorable in December and January are small cap stocks which are outperforming the S&P 500 Index over the last thirty days as the below chart shows, i.e., small company stocks as represented by the Russell 2000 Index are up 11.76% versus the S&P 500 Index return of 8.42% on a price only basis.
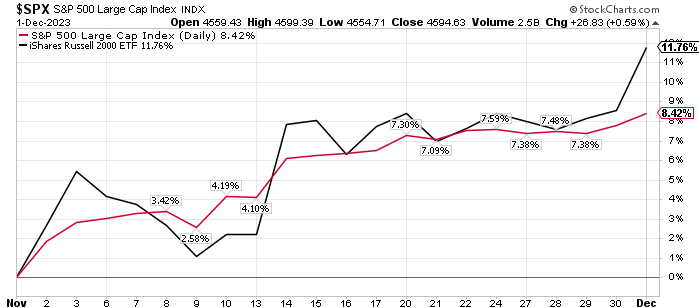 Also noteworthy in the large cap space, the smaller companies in the S&P 500 index are outperforming the larger ones. This is evident by the equal weighted S&P 500 Index outperforming the cap weighted S&P 500 Index, 10.45% versus 8.42%, respectively.
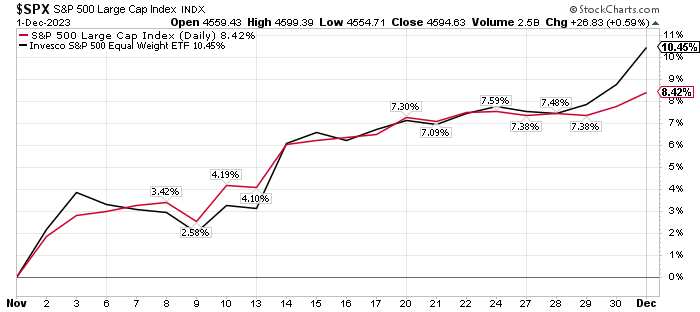 Over time the equal weighted Index has outperformed the cap weighted S&P 500 Index as noted by S&P Dow Jones Indices. More insight into this outperformance can be found in the company’s blog article, An Elevating Effect on Equal Weight.
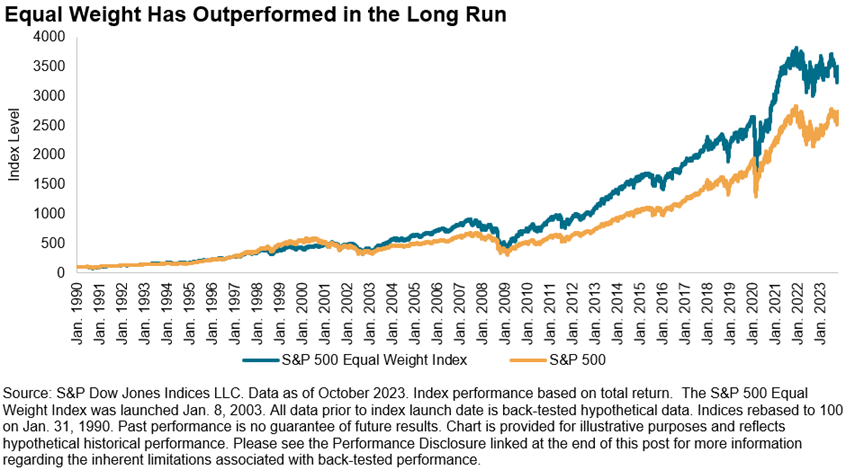 In summary, investors have enjoyed favorable returns in the equity market this year especially the outsized returns that have occurred in the mega cap stock space. Thirty days is certainly not a long period of time, but strength does seem to be occurring in stocks outside of the mega cap stock area. The S&P 500 Index is running up against technical resistance as it approaches the high reached at the end of July. A pullback in the index would not be a surprise and the first few weeks of December historically trade sideways. This sideways action or pullback, if it occurs, may lead to investors allocating some of their investment dollars into equity areas that have lagged the broader market this year, like small cap stocks.
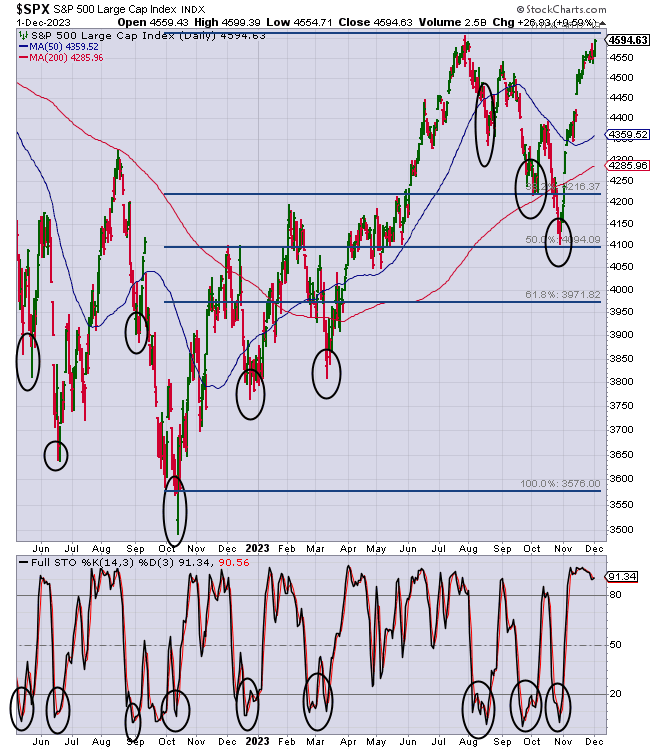 More By This Author:Keeping An Eye On The Unemployment Rate As A Recession Signal
Investors Shun Dividend Paying Stocks
Maybe Time To Look At Small Cap Stocks

Related Posts
 Crude Oil Bulls Have A Banner Week As Reasons To Be Long Multiply
- Users flock to Curve amid lack of stablecoin liquidity on major DEXs
- Binary Options Asset Insights For November 2, 2016
 US lawmakers propose SEC chair consider legislation, not enforcement approach to crypto
- U.K. 42-Year Low Unemployment Rate Fails To Spur Wage Growth
 August 2017 Kansas City Fed Manufacturing Remains Positive And Improves


Leave A Comment