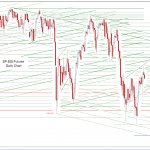
It was quite a volatile year, with a mix of collapses and rallies across markets. Think of gold’s breathtaking rise, crude’s collapse, and copper’s rally. After the summer, gold started collapsing while crude and stocks rallied strongly. With this year’s volatility, it is quite challenging to define a market outlook for 2017. To get a sense of what 2017 will bring, we analyze our proprietary market barometer and our leading market indicator.
The problem with many financial media outlets is that their market outlook sections contain so much and diverse information that it becomes an impossibility it to utilize that info for forecasting. That is why we developed a simple and straightforward methodology based one proprietary market barometer and one leading indicator.
Our proprietary market barometer
First, our market barometer looks at all leading markets, and gives a sense of intermarket dynamics. The point in this is that markets do not move in a vacuum, they move in relation to each other. For instance, early this year, gold rallied strongly as a sign of fear; consequently, crude and stocks tanked. Gold’s rally stalled when stocks started rallying. It is important to look at market trends as a function of each other.
Our market barometer displays the deviation of 7 leading markets from their 200 day moving average (DMA). A market trading above its 200 DMA is bullish and in a long term uptrend, a market below its 200 DMA is bearish and in a downtrend. The key challenge of our market barometer is to identify primary market trends based on how leading markets are moving against each other.
Right now, risk assets are in a bullish mode: stocks, yields, copper and crude are all in a long term uptrend. On the other hand, gold and the Japanese Yen, both fear assets, are in a long term downtrend.

‘Risk on’ market outlook 2017 based on this leading indicator


Leave A Comment