The New Zealand dollar enjoyed a very strong rally, rising to levels last seen in June 2015, mostly thanks to the weakness of the US dollar. Milk prices stand out this week? Here is an analysis of fundamentals and an updated technical analysis for NZD/USD.
Building consents leaped by 10.8%, providing some fuel for the kiwi’s rise. However, the bigger move above 0.69 came from the US: a very dovish speech by Yellen sent the dollar plunging across the board, and the “risk” NZD certainly benefited.
Updates:
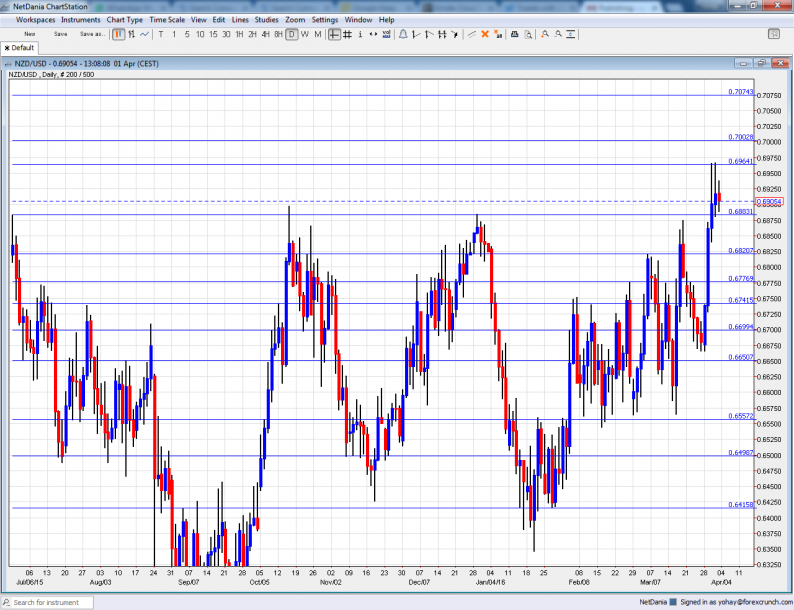
NZD/USD daily graph with support and resistance lines on it. Click to enlarge:

NZD/USD Technical Analysis
Kiwi/dollar had a gradual fall from the highs, struggling with the 0.67 level mentioned last week..
Technical lines, from top to bottom:
We start from higher ground this time. 0.7160 worked as support when the kiwi was trading on much higher ground in 2014. Also 0.7075 served as support back in mid 2014.
The round level of 0.70 is already in sight. The low of 0.6940 allowed for a temporary bounce.
The round 0.69 level has switched positions to resistance. 0.6860 was a low point as the pair dropped in June 2015. 0.6820 is worth noting after it capped the pair in March 2016.
It is followed by 0.6780 that capped the pair in recent months. The round level of 0.67 that works nicely as support. Another line worth noting is 0.6640, which capped the pair in November.

Related Posts
 As US Seeks To Lower Taxes, France Seeks To Hike Top Corporate Tax Rate To Whopping 45%
 Microsoft (MSFT) And Lockheed Martin (LMT): Growth And Income Stocks
 Twenty-Twenty Hindsight
 Limbach Holdings, Inc. (LMB): Dane Capital Expects ‘Significant Upside’ To Shares In 2018
 Futures Slide On Apple Disappointment, Oil Slumps Ahead Of Fed Decision
- E
The Global Outlook Dims, The US-China Trade Rift Makes Matters Worse


Leave A Comment