
Oil prices made a major peak in 2008. In many ways the peak is similar to the 1980 one. It took 24 years for prices to surpass the 1980 peak (see macrotrends.net chart below).
It has now been 10 years since the 2008 peak. This tells me that oil will struggle for many years to come, especially since the 2008 peak is even more significant.
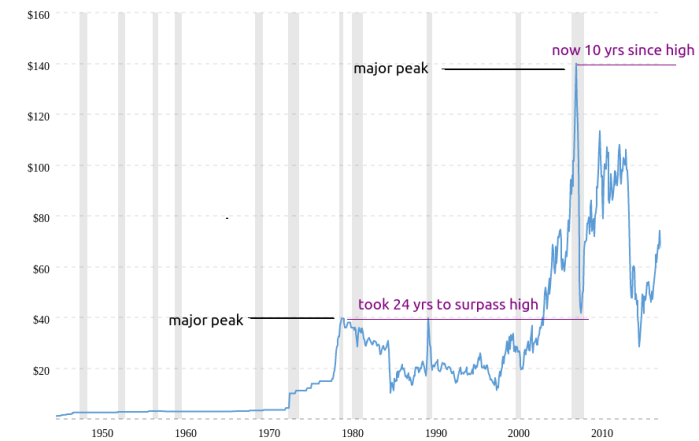
So, although the current correction since 2008 has been long and has gone really deep ($26), it is likely to continue much longer and go lower. These kind of corrections often go to at least 10% of the peak, which means oil could reach at least $14 (10% of $140).
However, I expect a sub $10 oil price.
In fact there is a good example to illustrate my point. That corporation is called Sony. Below, is a comparison of Sony and oil prices:
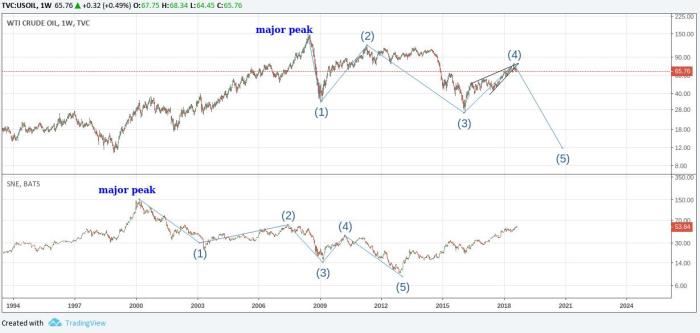
The top chart is for oil and the bottom is Sony. Sony made its major peak in 2000 at around $150. It has been correcting ever since (18 yrs already), in a 5-wave format. Its bottom was around $9.50 at the end of wave 5 (deeper than 10% of peak).
Oil has potentially completed its 4th wave, and will search for the bottom of wave 5. It’s going to the extreme of low. I will call this the miners wave, because gold miners will ride this down wave up.


Leave A Comment