The five-day rally that had lifted the S&P 500 by 3.60% ran out of steam today. Most of that rally’s gain was the result of the 2.39% advance on the first day, In fact, today’s closing loss of 1.12% essentially wiped out virtually all of the 1.18% gain of the last four sessions. Today’s selling came in two waves: A dramatic plunge at the open, a recovery of about half the loss by early afternoon, and a steady selloff in the final two hours of trading. Yesterday we asked if the upward trend was running out of steam. Today we got the answer.
The yield on the 10-year note closed at 1.83%, down eight basis points from the previous close.
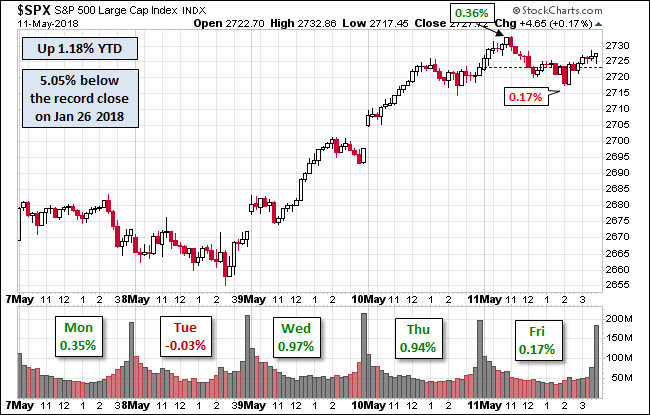
Here is a snapshot of past five sessions in the S&P 500.

Here is a daily chart of the index. Volume was unremarkable.

A Perspective on Drawdowns
Here’s a snapshot of selloffs since the 2009 trough.

Here is a more conventional log-scale chart with drawdowns highlighted.

Here is a linear scale version of the same chart with the 50- and 200-day moving averages.

A Perspective on Volatility
For a sense of the correlation between the closing price and intraday volatility, the chart below overlays the S&P 500 since 2007 with the intraday price range. We’ve also included a 20-day moving average to help identify trends in volatility.


Related Posts
 CEO Departure Doesn’t Equal Greener Pastures For Perrigo Company
 Gold To Perform Even Better In Hard Landing
 Gold – Dual Resistance Could Be Heavy, Says Joe Friday
- Oracle and Google go head to head in Android lawsuit
 “But It’s Only A Manufacturing Recession, What’s The Big Deal” – Here’s The Answer
 Pro-Inflation? Anti-USD?


Leave A Comment