The S&P 500 ended the session with a modest -0.48% decline and was up only 0.20% for the week. However, its monthly gain of 8.30% was the biggest one-month gain since its 10.77% four years ago in October 2011. In fact, since the index trough in March 2009, only four months have posted bigger gains: The aforementioned October 2011, 8.76% in September 2010, and the back-to-back month at the start of the current bull market, 9.39% in April 2009 and 8.54% in March 2009.
The yield on the 10-year note closed October at 2.16%, up 10 bps from the September monthly close.
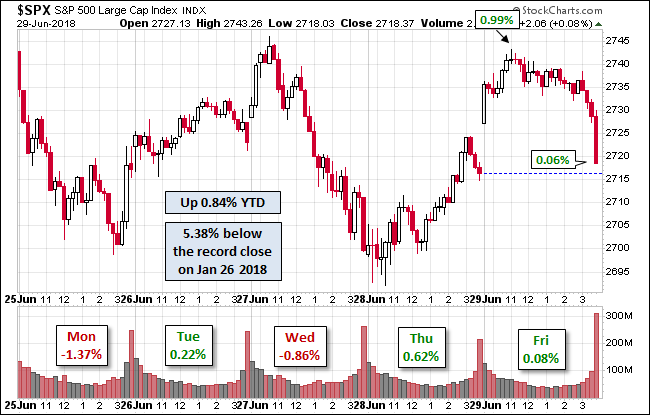
Here is a snapshot of past five sessions.

Here is a monthly chart of the index with those four outlier gains highlighted. The index is now only 2.42% below its record close in May.

A Perspective on Drawdowns
Here’s a snapshot of selloffs since the 2009 trough.

For a longer-term perspective, here is a log-scale chart base on daily closes since the all-time high prior to the Great Recession.

Here is the same chart with the 50- and 200-day moving averages. The 50 crossed below the 200 on August 28th.


Related Posts
 IMF chief economist calls for global policy on cryptocurrency
 Biogen Q4 Earnings Top Estimates; ’17 Sales View Soft
- Poland Unexpectedly Downgraded By S&P
- Investors Concerned With Continued Drop In Oil Prices
 MiCA’s stablecoin transaction cap stifles crypto adoption, say lawyers
- E
Celator Pharmaceuticals Soars 300% On Positive Phase 3 Results In High-Risk AML Patients


Leave A Comment