
Global markets spent the day trading in narrow ranges with fractional changes from their Friday closes. Japan’s Nikkei slipped 0.25%, China’s Shanghai rose 0.17%, the Euro STOXX 50 rose 0.30%. US equities followed suit. Our benchmark S&P 500 traded in a narrow range from its 0.06% intraday high shortly after the open to its -0.49% intraday low shortly before its trimmed closing loss of 0.32%.
The yield on the 10-year note closed at 1.78%, down one basis point from the previous close.
Here is a snapshot of past five sessions in the S&P 500.

Here is a daily chart of the index. Volume remains well below its 50-day moving average.

A Perspective on Drawdowns
Here’s a snapshot of selloffs since the 2009 trough.

Here is a more conventional log-scale chart with drawdowns highlighted.

Here is a linear scale version of the same chart with the 50- and 200-day moving averages.

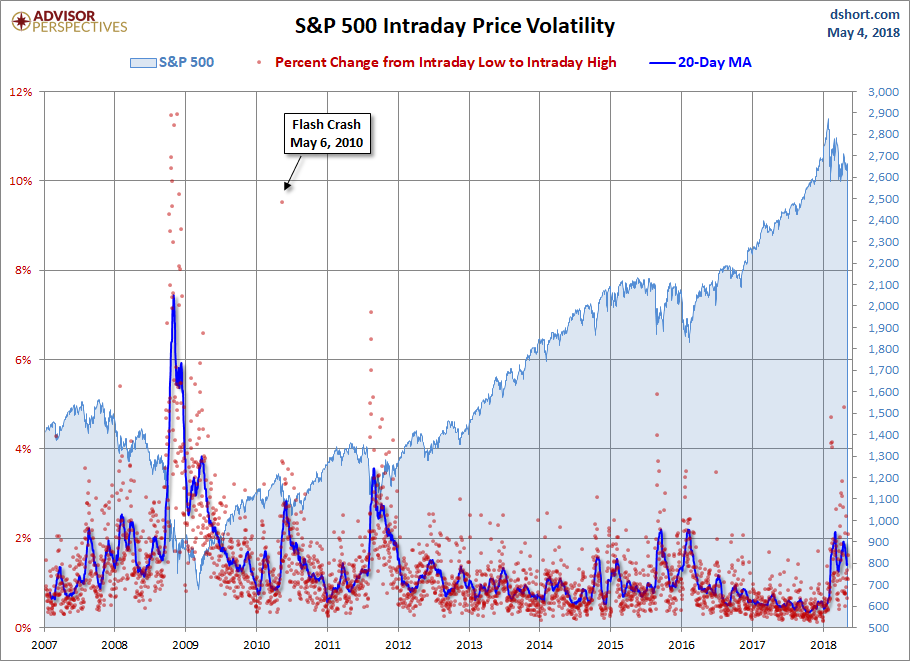
A Perspective on Volatility
For a sense of the correlation between the closing price and intraday volatility, the chart below overlays the S&P 500 since 2007 with the intraday price range. We’ve also included a 20-day moving average to help identify trends in volatility.

Related Posts
 Mozambique Bonds Crash On Plans To Restructure After Government Admits Nation In “Debt Distress”
 Gold Pauses On USD Strength
 China Planning Tariffs On U.S. Steel, Aluminum – We’re Gonna Need More Chocolate Cake
 Amazon Musings…
 ETF Momentum Rankings — June 4
 S&P 500 – Dangerous For Bull Case, If Prices Turn Weak Here


Leave A Comment