A good November employment report apparently set the stage for a rally in US equities, countering the dramatic selloffs in the Shanghai Composite (-1.67%) and Nikkei 225 (-2.18%) and modest declines in Europe (the Euro STOXX 50 at -0.38%). The S&P 500 soared at the open and rallied to its 2.16% intraday high near the beginning of the final hour. A bit of selling trimmed the daily gain to 2.05%, the biggest one-day advance since the 2.51% surge on September 8th. The index has now erased much of the loss over the previous two sessions.
The 10-year note closed at 2.28%, down 5 bps from yesterday’s close.
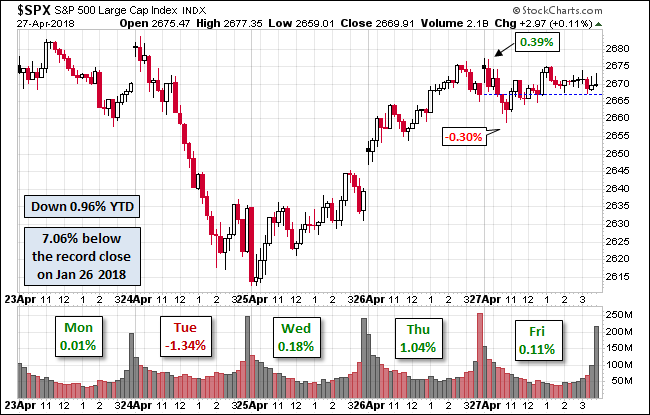
Here is a snapshot of past five sessions.

Here is a daily chart of the index. Trading volume was above its 50-day moving average but a bit lighter than on yesterday’s selloff.

A Perspective on Drawdowns
Here’s a snapshot of selloffs since the 2009 trough.

For a longer-term perspective, here is a log-scale chart base on daily closes since the all-time high prior to the Great Recession.

Here is the same chart with the 50- and 200-day moving averages. The 50 crossed below the 200 on August 28th.


Leave A Comment