On a day with little economic news, the S&P 500 opened in the red and spent the day oscillating in the third narrowest trading range of the year from its -0.53% morning low to its 0.31% high during at the end of the lunch hour. For some context, today’s 0.84% percent range from low to high is almost a full percent below the 2016 intraday average of 1.80%. The fractional closing gain of 0.09% extended the rally to five days, the longest since the five day advance that begin on September 29th of last year. The closing gain has been shrinking during the current rally, and today’s volume was light. Is the upward trend running out of steam?
The yield on the 10-year note closed at 1.91%, up three basis points from the previous close.
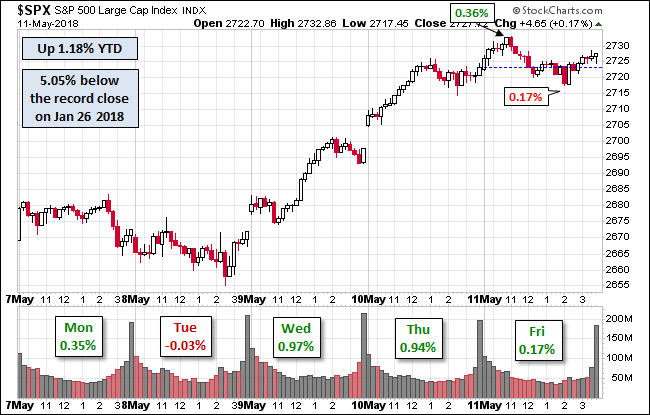
Here is a snapshot of past five sessions in the S&P 500.

Here is a daily chart of the SPY ETF, which gives a better sense of investor participation (or lack thereof). Volume today was quite light.

A Perspective on Drawdowns
Here’s a snapshot of selloffs since the 2009 trough.

Here is a more conventional log-scale chart with drawdowns highlighted.

Here is a linear scale version of the same chart with the 50- and 200-day moving averages.

A Perspective on Volatility
For a sense of the correlation between the closing price and intraday volatility, the chart below overlays the S&P 500 since 2007 with the intraday price range. We’ve also included a 20-day moving average to help identify trends in volatility.


Related Posts
 Revisiting Once More The True Worst Case
 NZD/USD Rebound Vulnerable Ahead Of New Zealand CPI
 US Dollar Bullish Momentum Faces Final Resistance Zone
 Record Low Volatility In Precious Metals And What It Means
 ISM Services Pull Back From A Multi-Year High
 Comments On A Flattening Yield Curve And The Spec Record Short VIX


Leave A Comment