Today the U.S. equity markets didn’t play copycat to oil prices. Crude futures finished the day up a bit over three percent, but our benchmark S&P 500 didn’t follow suit. The index made a modest morning rally to its 0.52% intraday high shortly before the lunch hour. It then sold off gradually for a couple of hours and then at an accelerated pace to its -0.81% close, just a tad above its -0.83% intraday low. Today’s selloff ended the hope of a February monthly gain. The leap-day close logged a -0.41% monthly close, the third consecutive monthly decline — something we haven’t seen since the 5-month selloff in 2011.
The yield on the 10-year note closed at 1.72%, down two basis points from the previous close.
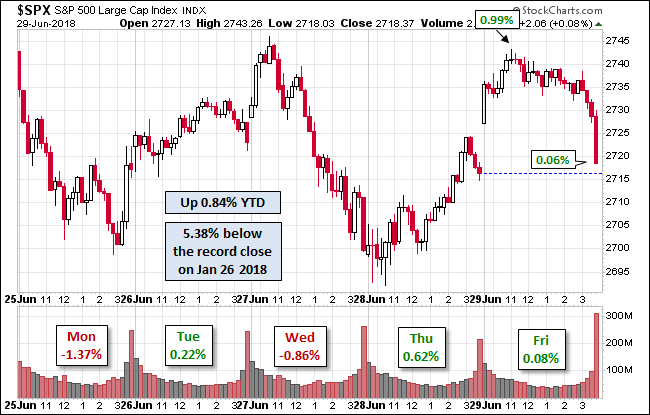
Here is a snapshot of past five sessions in the S&P 500.

Here is a monthly chart of the index. We can see that five-month selloff back in 2011. We also see that volume has increased over the past two months of selling.

A Perspective on Drawdowns
Here’s a snapshot of selloffs since the 2009 trough.

Here is a more conventional log-scale chart with drawdowns highlighted.

Here is a linear scale version of the same chart with the 50- and 200-day moving averages.

A Perspective on Volatility
For a sense of the correlation between the closing price and intraday volatility, the chart below overlays the S&P 500 since 2007 with the intraday price range. We’ve also included a 20-day moving average to help identify trends in volatility.


Related Posts
 Ray Dalio – The Problem Is With The Markets: Not With Mario Draghi’s Policies
 SEC and exchanges agree to bolster circuit breakers
 Commitment Of Traders: Futures, Hedge Fund Positions, More For The Week
 Failing Thursday – Comey Testifies, ECB Goes Neutral And Oil Collapses
- Here’s What Matters Most While Volatility Soars
- Let’s Talk About Helicopter Drops (Again)


Leave A Comment