
Today major equity indexes in Asia posted gains, but their Europe and US counterparts finished the session uniformly in the red. Yesterday’s loss for our benchmark S&P 500 was its sixth consecutive decline … something that hasn’t happened since August of last year. The index hit its 0.25% intraday high shortly after the open and sold off to its -1.33% mid-afternoon low, at which point a “buy-the-dip” strategy halved the loss to -0.68% at the close. About that “buy-the-dip” strategy: It was no doubt triggered by the S&P 500 dropping below the 2100 level, a situation that lasted for about eight minutes.
The 10-year closed the session at 1.83%, down one BP from the previous close. Here is a snapshot of past five sessions in the S&P 500.

Here’s a daily chart of the index. A preliminary read on volume showed an increase to 19% above its 50-day moving average.

A Perspective on Drawdowns
Here’s a snapshot of selloffs since the 2009 trough.

Here is a more conventional log-scale chart with drawdowns highlighted.

Here is a linear scale version of the same chart with the 50- and 200-day moving averages.

A Perspective on Volatility
For a sense of the correlation between the closing price and intraday volatility, the chart below overlays the S&P 500 since 2007 with the intraday price range. We’ve also included a 20-day moving average to help identify trends in volatility.


Related Posts
 Look For Strong US Dollar Near-Term, Then Long Slide Down: Natixis
 Bob Evans Farms, Inc. Reports Impressive First Quarter FY 2018 Results And Raises Guidance
 Turkey And Russia May Ditch Greenback For Direct Lira-Ruble Trade
- Weekly Wrap-Up, Market Forecast, Sector Watch: SPX, Nasdaq, XRT
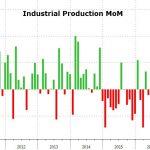 Industrial Production Disappoints In November – Remains Below 2014 Peak
- The Four Totally Bad Bear Recoveries; Where Is Today’s Market?


Leave A Comment