
The Federal Reserve has followed through on their assertions to raise the federal funds rate off the zero bound. It’s been all everyone has talked about for awhile now so I don’t think there is anymore to say at this point. Now the focus shifts to the markets reaction going forward.

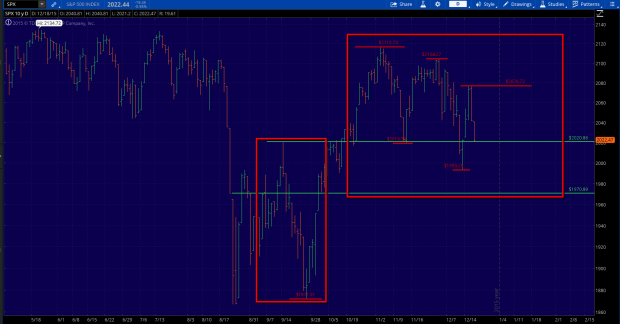
After a 13% rally off the August “mini flash crash” lows the S&P 500 has gotten back to churning inside of the prior trading range between 1980 and 2100. The recent pattern, as depicted on the chart above, has been a series of 100 point declines followed by 85 point rallies.
I’ve highlighted the support levels going forward as the green horizontal lines at 2020 and 1970. Today we hit the 2020 level and so we’ll see if that support level is enough to break the grip of this short term downtrend. If 2020 fails to hold I would expect and anticipate a decline down to 1970, the lowest of the two green horizontal lines.
There are a variety of confluence areas at 1970, which is why it makes it compelling if it gets there.
First, 1970 would match the size of the first decline after the August lows (red rectangle boxes) 150 pts.
Second, 1970 is the settlement price for the day prior to the flash crash of August 24th.
Third, 1970 would fall in line with the recent short term downtrend of 100 pts lower, 85 points higher, as depicted in the first chart above.
If the markets spend time below 1970, that would leave me to believe the August lows are in danger.


Leave A Comment