
In the free analysis that we posted last Monday, we warned that Friday’s session was likely to be volatile and tricky. This seems to have indeed been the case for silver. The white metal declined early in the day only to rally almost 40 cents from the initial low. In our previous alert, we discussed the possibility of silver topping at about $16.65 and this level was reached. Is silver about to take a dive just like it did in late November 2017?
In short, yes. That seems very likely, especially in light of the multiple long-term and short-term factors and we have received a strong bearish confirmation earlier this week. However, we need to supplement the above with a caveat – the decline may not start immediately, but in a few days. Why? Because of the proximity to the triangle apex reversal along with the lack of a visible rally on Friday suggest that we may still be a day or two away from the top.
The key word from the above paragraph is may. The mentioned combination of bearish signs could be immediately followed by a big slide. That’s how silver performs quite often right after a session during which it outperformed.
Silver Repeats Itself for Those Who Were Not Listening

November 17, 2017 and March 6, 2018 serve as good examples.
Consequently, we were and still are in a situation when the white metal could either decline sharply right away and move significantly lower or it could move up just a little and then decline sharply anyway. In our opinion, waiting to open a short position for even better prices seems to be a gamble in a game in which the odds are really against us. If we’re about to profit from the $1+ slide in silver, then the possibility of seeing another 10-20 cent upswing while risking missing a 50-cent initial (or so) decline just doesn’t seem to be worth it.
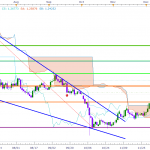
While we’re discussing the above chart, please note that the Stochastic indicator just flashed a sell signal, confirming our analysis.
Gold’s Seemingly Bullish Reversal

What’s particularly interesting is that gold formed a bullish reversal after breaking below the 50-day moving average. Looks familiar? It should as we saw something similar not too long ago – on December 1st, 2017. That was the session that followed the breakdown below the 50-day moving average after the final top. Friday was also the day that followed the breakdown below the 50-day moving average after (what’s likely to have been) the final top.
Single-day analogies are generally not very reliable (more similar cases with a certain outcome are generally needed for the implications to become important), but it’s something worth keeping in mind anyway. Especially that it fits the performance that we often see close to the release of important economic data.
Back on December 1st, gold moved higher, erasing most of its recent short-term downswing, but ended the session only a bit higher, forming a major reversal. If we see something similar in the next few days, gold could move to approximately $1,335 before declining. Again, based on silver’s outperformance, it’s a big “perhaps”.

Related Posts
 July 2017 Trade Balance Insignificantly Worsened
 You’ll Never Guess What Happened To BuzzFeed’s IPO Chances After It Missed Revenue By 20%
 NAFTA Trade Update
- Fed Chickens Out Again, Fails To Raise For 55th Consecutive Time – FOMC Statement Comparison
- Metals Markets Report – Friday, August 17
 GBP/USD Tries Ichimoku Cloud’s Upper Band Once Again


Leave A Comment