You have to wonder whether there are any carbon units left in the casino. The robo traders and HFTs, of course, have an attention span of 10 milliseconds. So their utter lack of concern about context, fundamentals and history is readily explainable. They never get around to it.
But somebody besides the machines is getting paid the big bucks on Wall Street. Do they really think that dancing on a live volcano, as the estimable Ambrose Evans-Pritchard put it recently, is not semi-suicidal?
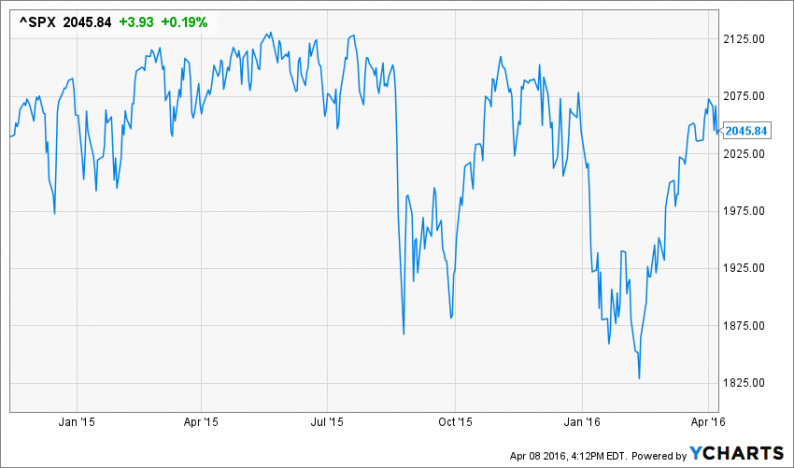
Yet for the last 18 months that is exactly what they have been doing. The S&P 500 closed today exactly where it first crossed in November 2014. In the interim, its been a roller-coaster of rips, dips, spills and thrills.

^SPX data by YCharts
The thing is, however, this extended period of sideways churning has not materialized under a constant economic backdrop; it does not reflect a mere steady-state of dare-doing at the gaming tables.
Actually, earnings have been falling sharply and macroeconomic headwinds have been intensifying dramatically. So the level of risk in the financial system has been rocketing higher even as the stock averages have labored around the flat-line.
Thus, GAAP earnings of the S&P 500 in November 2014 were $106 per share on an LTM basis compared to $86.44 today. So earnings are down by18.5%, meaning that the broad market PE multiple has escalated from an already sporty 19.3X back then to an outlandish 23.7X today.
And the latter is by no means reflective of an expected stick save turnaround in earnings. Analysts have been furiously marking down their estimates for Q1 for weeks now. At the latest reading profits are projected to fall by 10%, marking the fifth straight quarter of decline.
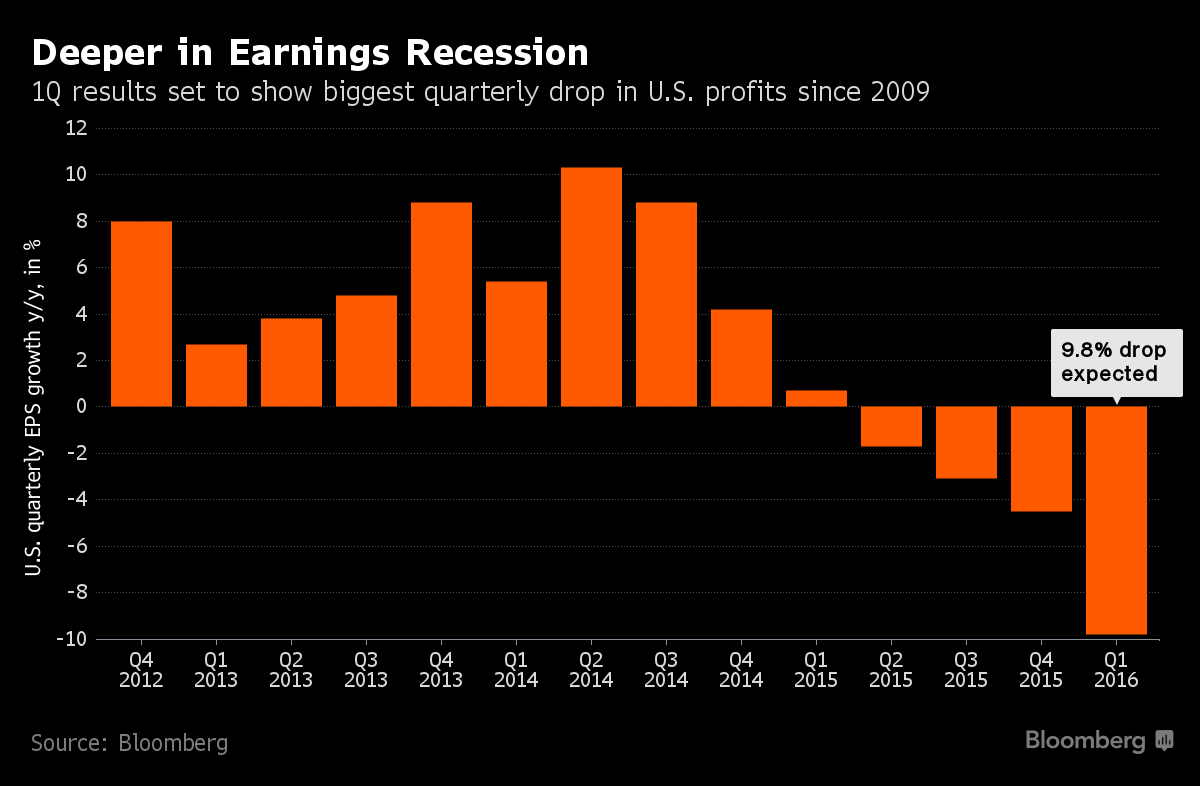
Always and everywhere, such persistent profit collapses have signaled recession just around the corner. And there are plenty of macro-economic data points signaling just that.
For instance, total US business sales have fallen by 5.1% since mid-2014—-even as inventories have soared. This means that while Wall Street speculators have been dancing on the edge of the volcano for 18 months, the US economy’s tepid rebound has been petering out.
Indeed, there has never been an inventory ratio surge of the magnitude shown in the chart below—-from 1.29X to 1.40X in 18 months—- that did not signal a recession dead ahead.
During the stock market’s most recent dead-cat bounce, the signals that the US economy is drifting into a downturn have only grown more frequent and intense. For instance, class 8 truck orders—-a classic leading indicator—–are now plunging.At the same time, inventories haven’t been this high since early 2007.

Related Posts
 Dividend Aristocrats Part 50: Johnson & Johnson
 Starbucks Earnings: Weak Same Store Sales Will Hurt Starbucks Corporation Stock
- Synthes reports merger talks with Johnson & Johnson
 Comcast Corporation, Ford Motor Company Shares Rise On Earnings
 Treasury Sells 30Y Bonds At The Lowest Yield Since January
 Not For Long


Leave A Comment