I last wrote about volatility (SPX:VIX ratio) in my post of January 28.
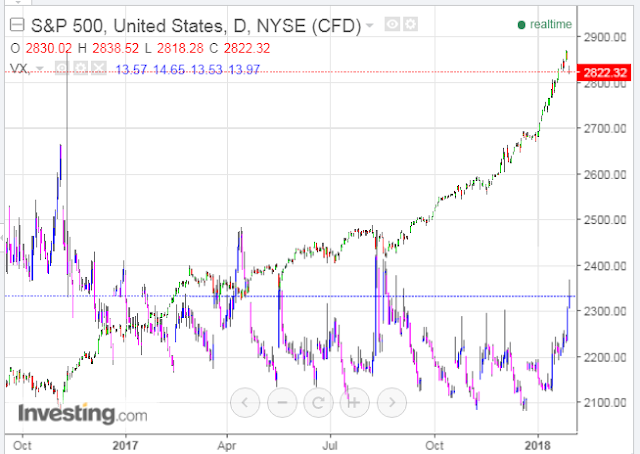
Today, the major indices gapped down at the open and closed near their lows. Here’s how the S&P 500 Index (SPX) closed, with the VIX overlayed (daily chart).

This monthly chart of the SPX:VIX ratio shows today’s close below major support of 200.
The momentum indicator has fallen to just above the zero level on this timeframe…a drop and hold below would indicate increased selling pressure in equities.

And, for a slightly different perspective, the last monthly chart depicts the SPX in the upper half and the SPX:VIX ratio (in histogram format) in the lower half).
Price on the ratio has fallen below the 20-month moving average (yellow)…hinting of further weakness ahead.
I’ll provide an update on where the monthly candle closes on this ratio in relation to major support, its momentum, and the moving average at the end of tomorrow’s month-end trading, so stay tuned.


Leave A Comment