
T2108 Status: 35.4%
T2107 Status: 25.7%
VIX Status: 21.1
General (Short-term) Trading Call: Bullish
Active T2108 periods: Day #4 over 20%, Day #1 under 30% (underperiod – ended 2 days over 30%), Day #23 under 40%, Day #83 under 50% (correction reduced by a day), Day #100 under 60% (correction reduced by a day), Day #305 under 70% (correction added 6 days)
Reference Charts (click for view of last 6 months from Stockcharts.com):
S&P 500 or SPY
SDS (ProShares UltraShort S&P500)
U.S. Dollar Index (volatility index)
EEM (iShares MSCI Emerging Markets)
VIX (volatility index)
VXX (iPath S&P 500 VIX Short-Term Futures ETN)
EWG (iShares MSCI Germany Index Fund)
CAT (Caterpillar).
Commentary
Friday, September 18, 2015 was a strange day that started as a true head-scratcher.
Very surprising too see $SPY (sell-off) and $AUDJPY (rallying) so far out of sync. Can’t last. Betting on #forex as leading indicator.
— Dr. Duru (@DrDuru) September 18, 2015
As it turned out, AUD/JPY eventually weakened a bit. Still, the Australian dollar (FXA) versus Japanese yen (FXY) pair did not turn downward as much as I would have expected given the S&P 500 (SPY) lost a full 1.6% by the end of the day. The NASDAQ (QQQ) also had a very bearish day failing at 50DMA resistance.

AUD/JPY loses some momentum as it fades in the face of resistance from the previous high
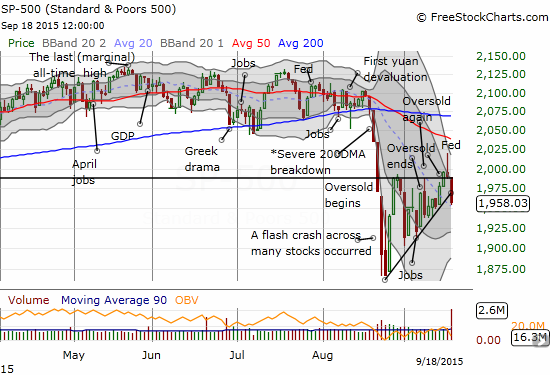
The S&P 500 crashes right through the bottom of the previous wedge pattern. A danger sign with an imminent Bollinger Band squeeze.

The NASDAQ confirms a rejection from 50DMA resistance
I was clearly premature in declaring on Thursday that the S&P 500 (SPY) was close to a breakout. Now, the S&P 500 is on the ledge of a breakdown as the lower support from the rising wedge gave way today. This was a line I was over-confidently expecting to hold. I even bought a fresh tranche of call options on ProShares Ultra S&P500 (SSO) expecting the down gap to soon fill.

Related Posts
 As Bitcoin Tops $8,200, Only 39% Of Survey Respondents Say It’s A Bubble
 Grant Williams: The End Of The Road
- 5 Interesting Facts About The Euro
- USD/JPY Eyes Monthly-Low As US Producer Price Index (PPI) Disappoints
 Work Five More Years… And Increase Your Income 117%
- DAX 30 Tests Lower End Of The 9,739-10,111 Range


Leave A Comment