
With April now behind us, investors now enter into the seasonally weak 6-month period of the year. It is also the annual “right of passage” as the debate over the old Wall Street axiom “Sell In May And Go Away,” rages. As I noted in last week’s Technical Update:
“As we wrap up the month of April, we now begin the march into the seasonally weaker period of the year. As noted by Nautilus Research, the markets tend to get choppy over the next couple of months.”

Just recently at the 2017 Economic & Investment Summit, Greg Morris made an interesting statement worth considering in today’s discussion:
“If you believe something that you learned from your parents, or teachers, when you were young and have never questioned; how many things about investing and finance do you believe today but have never questioned?”
It is from this point that I want to discuss the issue of “Sell In May.”
Let’s start with a basic assumption.
I am going to give you an opportunity to make an investment where 70% of the time you will win, but by the same token, 30% of the time you will lose.
It’s a “no-brainer,” right?
So, you invest and immediately lose. In fact, you lose the next two times, as well. Unfortunately, you just happened to get all three instances, out of ten, where you lost money. Does it make the investment any less attractive? No.
But this is exactly what happens to investors all the time. They read about some investment strategy, or discipline, that historically has had a very high success rate, so, they jump in. Of course, as luck would have it, the next year market dynamics change somewhat and the strategy doesn’t work. Since, whatever strategy is obviously flawed, they jump to the next “hot” trend from last year.
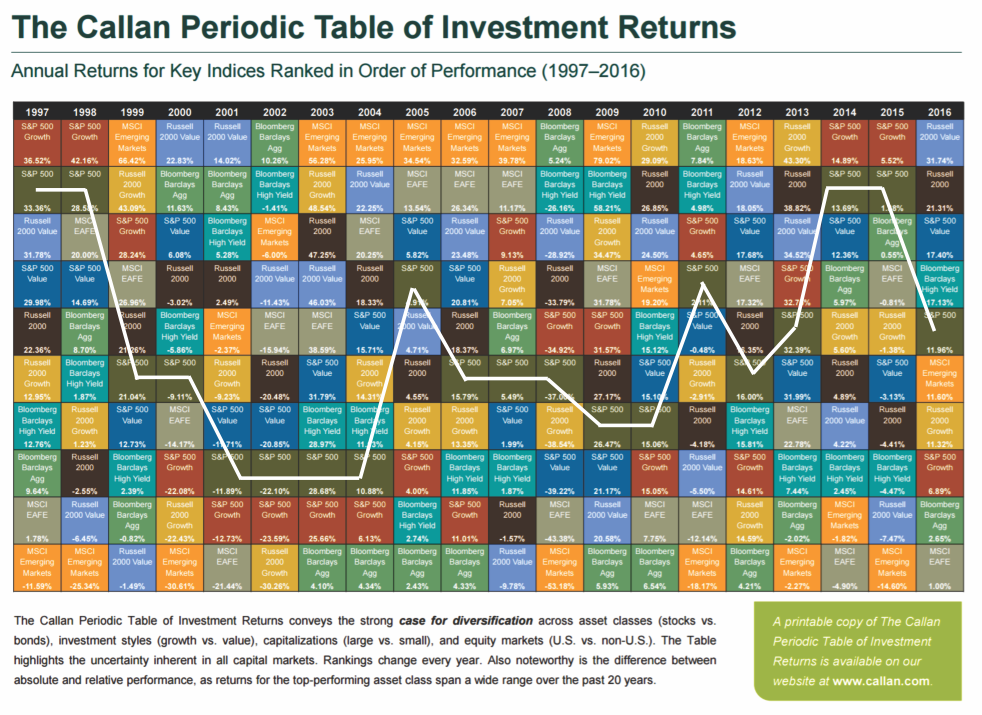
This “rotation” can be seen in the Callan Periodic Table Of Returns. Most investors tend to “buy” whatever was “hot” last year, but as you can see, it rarely stays that way for long.
Wash. Rinse. Repeat.
In most instances, the analysis of “Sell In May” typically uses too short of a timeframe looking back only to the beginning of the last secular “bull market” that begin in the early 1980’s. Even Nautilus’ analysis above, while excellent, only looks back at the last 20-years. In order to properly analyze the historical tendencies of the markets, particularly given the impact of Central Bank interventions in recent years, we need a more extensive data set.

Related Posts
 EUR/USD: Rebound From The Trend Line
 USD/JPY NFP Analysis: Watch For Rejection Or Breakout
 U.S. Debt Rockets Up $339 Billion In A Single Day
 Amid P2E downturn, Sky Mavis turns to user-generated content for Axie Infinity
- Is Apple’s Open Secret Car Project Even Worth It?
 Cybersecurity analyst reveals 8 sneaky crypto scams on Twitter right now


Leave A Comment