

Last week, as the Fed wrapped up their annual Jackson Hole confab, the markets sold off following suggestions the Fed might just hike rates in September after all. On Monday, the markets rallied to recover a majority of that lost ground keeping the markets confined within the very narrow, low volatility, range that has existed for the last 35-trading days.
I discussed in this past weekend’s missive the likely range of outcomes that currently exist. (Charts updated through Monday’s close.)
“The weekly full-stochastic indicator as shown in the chart below has issued a ‘sell signal.’ Combined with the volatility index turning up from extremely low levels, it suggests a near-term potential for a continued corrective action.”
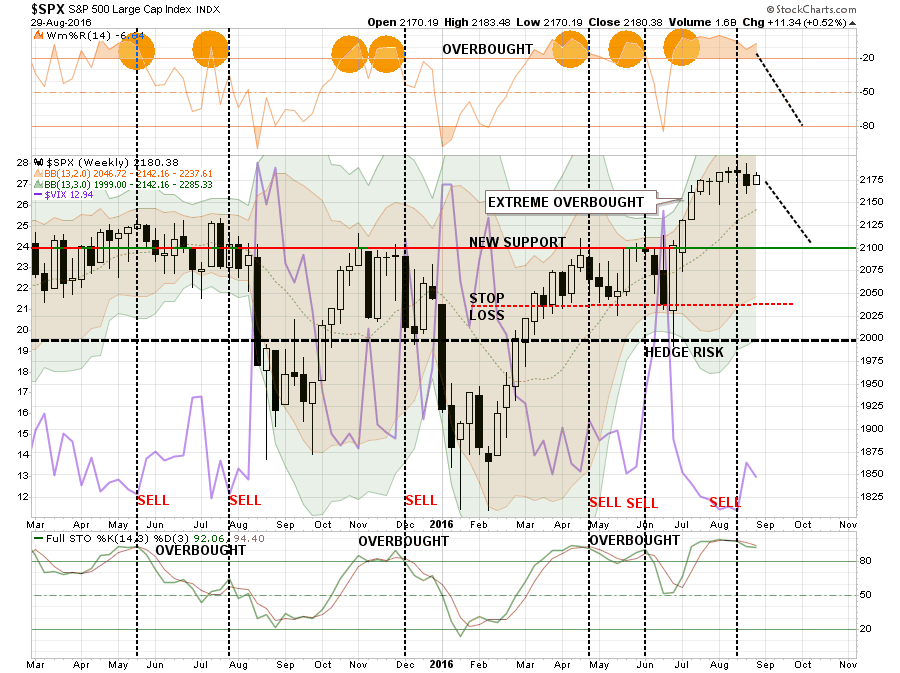
The chart above is also being confirmed by a short-term momentum “sell signal” from very high levels which has historically led to short-term pullbacks or deeper corrections.

Of course, following the “Brexit” surge as Central Banks rushed to infuse capital into the markets to offset a “crisis that didn’t occur,” the market has remained in suspended animation over the last several weeks.
With the markets, on a short-term basis, remaining in overbought territory, there is little “fuel” presently available to push the prices higher currently. Therefore, downside risk outweighs the potential for upside returns in the market currently.
What September Bringeth
BofAML wrote last week:
“History is working against the market. September is typically the weakest month of the year; since 1928, the S&P 500 has dropped in September 56% of the time.”

We can confirm BofAML’s point by looking at the analysis of each month of September going back to 1960 as shown in the chart below.

As shown, the average return for all months of September is -.70% with a median return of -.42%. More importantly, the statistics for September are universally negative. The number of losing months outweighs winning months by 31 to 25 which gives September a 55% chance of being negative historically speaking. While the “average and median” losses are less than 1%, this analysis obscures the fact that many September months registered losses of greater than 3%.

Related Posts
 EC
10 Dividend Stocks To Load Up On For The Rest Of 2015
EC
10 Dividend Stocks To Load Up On For The Rest Of 2015- Michaels Companies, Inc. Q4 Profit Beats, 2017 Outlook Strong
 E
The German Economy Also Expanded Strongly In The Second Quarter
E
The German Economy Also Expanded Strongly In The Second Quarter Stocks And Precious Metals Charts – Round Up Time – The Fed Returns To Jackson Hole
- Gold Jigged, Silver Rigged, Stocks Pigged
- 5 Value Stocks With High Dividend Yields To Buy Now


Leave A Comment