
The Bureau of Economic Analysis announced today that U.S. real GDP grew at a 2.6% annual rate in the fourth quarter. That is better than the 2.2% we’ve seen on average since the Great Recession ended in 2009, though below the historical average growth rate for the U.S. economy of 3.1%.
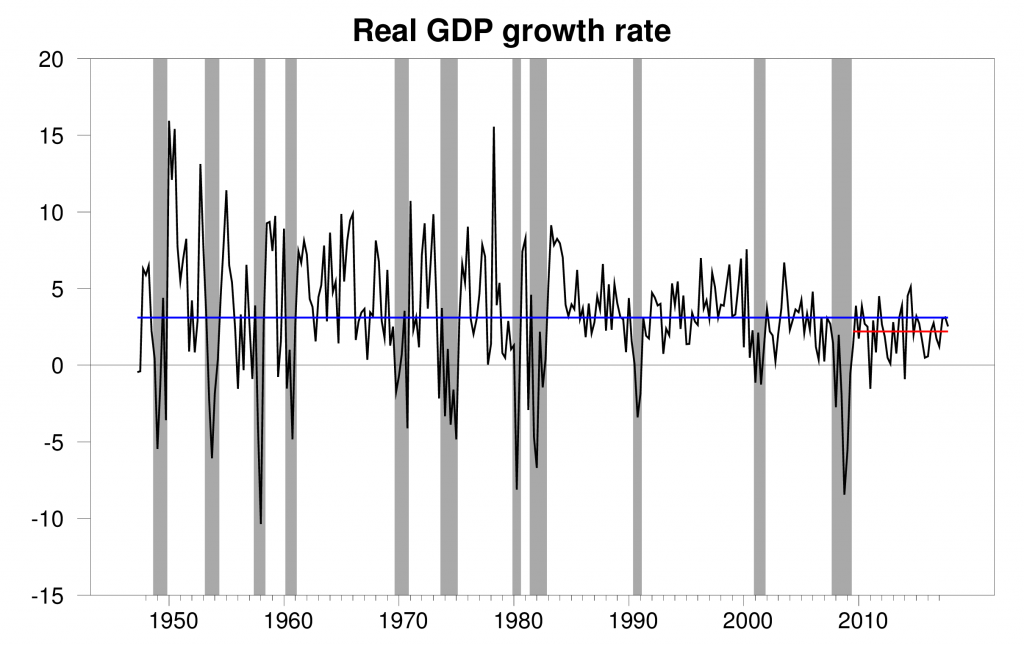
Real GDP growth at an annual rate, 1947:Q2-2017:Q4, with the 1947-2017 historical average (3.1%) in blue and post-Great-Recession average (2.2%) in red.
Solid growth over the last three quarters has brought our Econbrowser Recession Indicator Index down to 2.4%. The U.S. remains clearly in the expansion phase of the business cycle.

GDP-based recession indicator index. The plotted value for each date is based solely on information as it would have been publicly available and reported as of one quarter after the indicated date, with 2017:Q3 the last date shown on the graph. Shaded regions represent the NBER’s dates for recessions, which dates were not used in any way in constructing the index, and which were sometimes not reported until two years after the date.
Consumption spending, residential and nonresidential fixed investment and government purchases all grew strongly during the quarter. However, much of the new spending went to imports, whose growth ended up subtracting two percentage points from the annualized growth rate that would have resulted if all the new spending had been on domestically produced goods and services. Some of the spending also went on goods sold out of inventory (goods sold but not produced), which subtracted another 0.7% from the annualized growth rate.
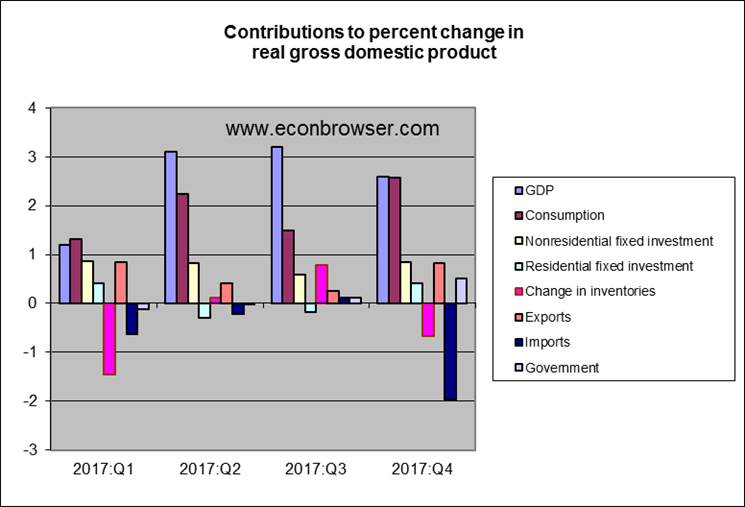
Imports and inventories are the two most volatile components of GDP, often changing from one quarter to the next, and indeed estimates of these two numbers for the fourth quarter could change as we receive better data. Overall, I conclude that solid economic growth continues.

Related Posts
 US GDP Misses With 2.6% – USD Falls
 Building Boom Before Infrastructure Bill
- 3 reasons why traders expect Bitcoin to retake $60K before November ends
 Guidance Readings Down But Still Positive
- Aussie advisory committee lists key factors for easing crypto adoption
 WTI Crude Oil And Natural Gas Forecast – Friday, August 25


Leave A Comment