This week we’ll begin with our monthly and weekly forecasts of the currency pairs worth watching. The first part of our forecast is based upon our research of the past 16 years of Forex prices, which show that the following methodologies have all produced profitable results:
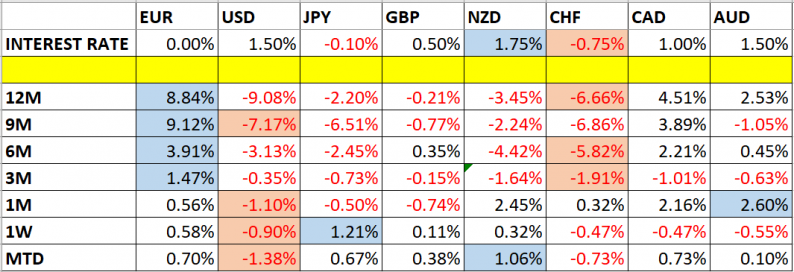
Let’s take a look at the relevant data of currency price changes and interest rates to date, which we compiled using a trade-weighted index of the major global currencies:

Monthly Forecast January 2018
For the month of January, we forecast that the best trades will be long EUR/USD and long GBP/USD. The performance so far is as follows:

Weekly Forecast January 14, 2018
Last week, we made no forecast.
This week, we again make no forecast, as there were no strong counter-trend movements last week.
This week has been dominated by relative strength in the Japanese Yen, and relative weakness in the U.S. Dollar.
Volatility was a little higher, with 37% of the major or minor currency pairs changing in value by more than 1%. Volatility is likely to be higher still over this coming week.
Key Support/Resistance Levels for Popular Pairs
We teach that trades should be entered and exited at or very close to key support and resistance levels. There are certain key support and resistance levels that should be watched on the more popular currency pairs this week, which might result in either reversals or breakouts:

Let’s see how trading one of these key pairs last week off key support and resistance levels could have worked out:
EUR/JPY
We had expected the level at 133.02 might act as support, as it had acted previously as both support and resistance. Note how these “flipping” levels can work well. The H1 chart below shows the how the price hit this level at the end of the New York session last Wednesday. This can be a very important time in the Forex market, especially for Japanese Yen currency crosses such as this pair. Entry was signaled by the bullish doji candle which formed immediately after the price was hit, marked by the up arrow within the chart below. This long trade gave an excellent maximum reward to risk ratio of more than 12 to 1 to date, if the stop had been placed just below the swing low at the entry candlestick.

Related Posts
 Why We Won’t Have A “Lehman Moment” In The 2016 Crash
- USD/CAD Price Outlook: Loonie Threatens Breakout On Easing Trade Tensions
- Reviewing The Moves This Week In The Dow, Gold And Silver
 XRP price rally stalls near key level that last time triggered a 65% crash
 Gold Prices Rise As Equities Retreat
 OPEC Extends Cuts, Opening Door For U.S. To Gain Further Market Share


Leave A Comment