For those readers who are not aware of Nostradamus, he is viewed as being one of history’s better prognosticators. Granted, he never had the difficult assignment of trying to forecast the direction of the U.S. Treasury (UST) 10-Year yield, but given the track record of projections over the last decade, it becomes readily apparent that Nostradamus would have had little to fear from a reputational standpoint.
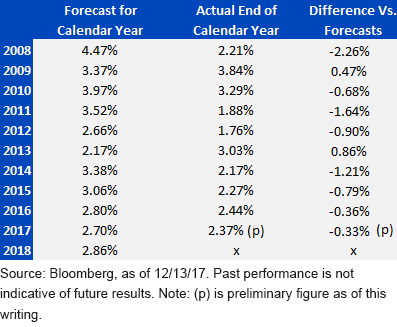
The table below highlights what the consensus forecasts were for the UST 10-Year yield beginning in 2008 through the present (10 observations), what the actual yield was to end that calendar year and, of course, any difference that may have existed between the two. The current year is still not final, so I am using the UST 10-Year yield as of this writing, while the 2018 number is the latest forecast available. The results are not too comforting for those in the forecasting business, to say the least, and underscores the point that the estimates should be used more as a talking point and not necessarily as a basis to use when implementing a fixed income portfolio (more on this later).
UST 10-Year Yield Forecasts vs. Actuals

Let’s take a quick look at the results. Of the 10 projections, 8 have come in too high, while only 2 were lower than the actual respective year-end level. In other words, over the last 10 years, 80% of the time the UST 10-Year yield ended up being lower than the forecast. Some of the magnitudes of these differences have been notable as well: -226 basis points (bps) in 2008, -164 bps in 2011 and -121 bps in 2014, to name the top three largest variations. It is interesting to note that the UST 10-Year forecasts have missed to the upside for the last four years (assuming 2017 continues to play out as present), with the average miss potentially being -67 bps.
Let’s return to the point I mentioned earlier. Should target forecasts be seen as integral in the investment process? I always have held to the belief that a year-end projection is just a snapshot and investors should look at trading ranges as a more useful tool. Let’s take 2017 as an example, where the UST 10-Year yield has traded between a low point of 2.04% to a high watermark of 2.63%. If you were one of the forecasters who predicted the consensus estimate of 2.70%, you probably felt pretty good in March when the aforementioned high point was printed. However, after Labor Day, when the trough was recorded, you may have been thinking about going back to the drawing board. Instead, if you were to look at it from a trading range point of view, you could have acknowledged the changing dynamics that can occur in any given calendar year, and that the overall trend for the year as a whole essentially has been unchanged: December 30, 2016—2.44%; Dec. 13, 2017—2.37%.


Leave A Comment