
This week’s news was positive. The BEA released their first estimate of 3Q GDP — a healthy 3% annual rate. The Chicago Fed’s National Activity Index increased and durable goods orders were up. New home sales also increased. While a large, post-Harvey surge in the South was mostly responsible, there were also increases in the three other regions.
This week, the BEA released their first estimate of 3Q GDP, which was up 3% on an annual basis and 2.3% on a Y/Y basis. The one area of concern was the continued decline in residential investment, which only rose .9% in the latest quarter and has been declining for the last five. But durable goods consumption expenditures were strong (up 8.3% Y/Y). And nonresidential investment spending on equipment rose a healthy 5.2%. Overall, this was a good report.
On Monday, the Chicago Fed released their latest National Activity Index. On one hand, this is a great indicator; it combines 85 individual statistics into a simple, fairly easy to understand number. On the other hand, the large number of indicators makes this index a bit unwieldy. The index does, however, have a good record tracking the current state of the US economy.

Above is a scatterplot of the quarterly Y/Y percentage change in real GDP and the CFNAI; the two numbers have a .72 correlation – which is statistically significant. The index ticked higher last month:
Led by improvements in production-related indicators, the Chicago Fed National Activity Index (CFNAI) moved up to +0.17 in September from –0.37 in August.All four broad categories of indicators that make up the index increased from August, and three of the four categories made positive contributions to the index in September. The index’s three-month moving average, CFNAI-MA3, was unchanged at –0.16 in September.
The three-month moving average takes out some of the noise:
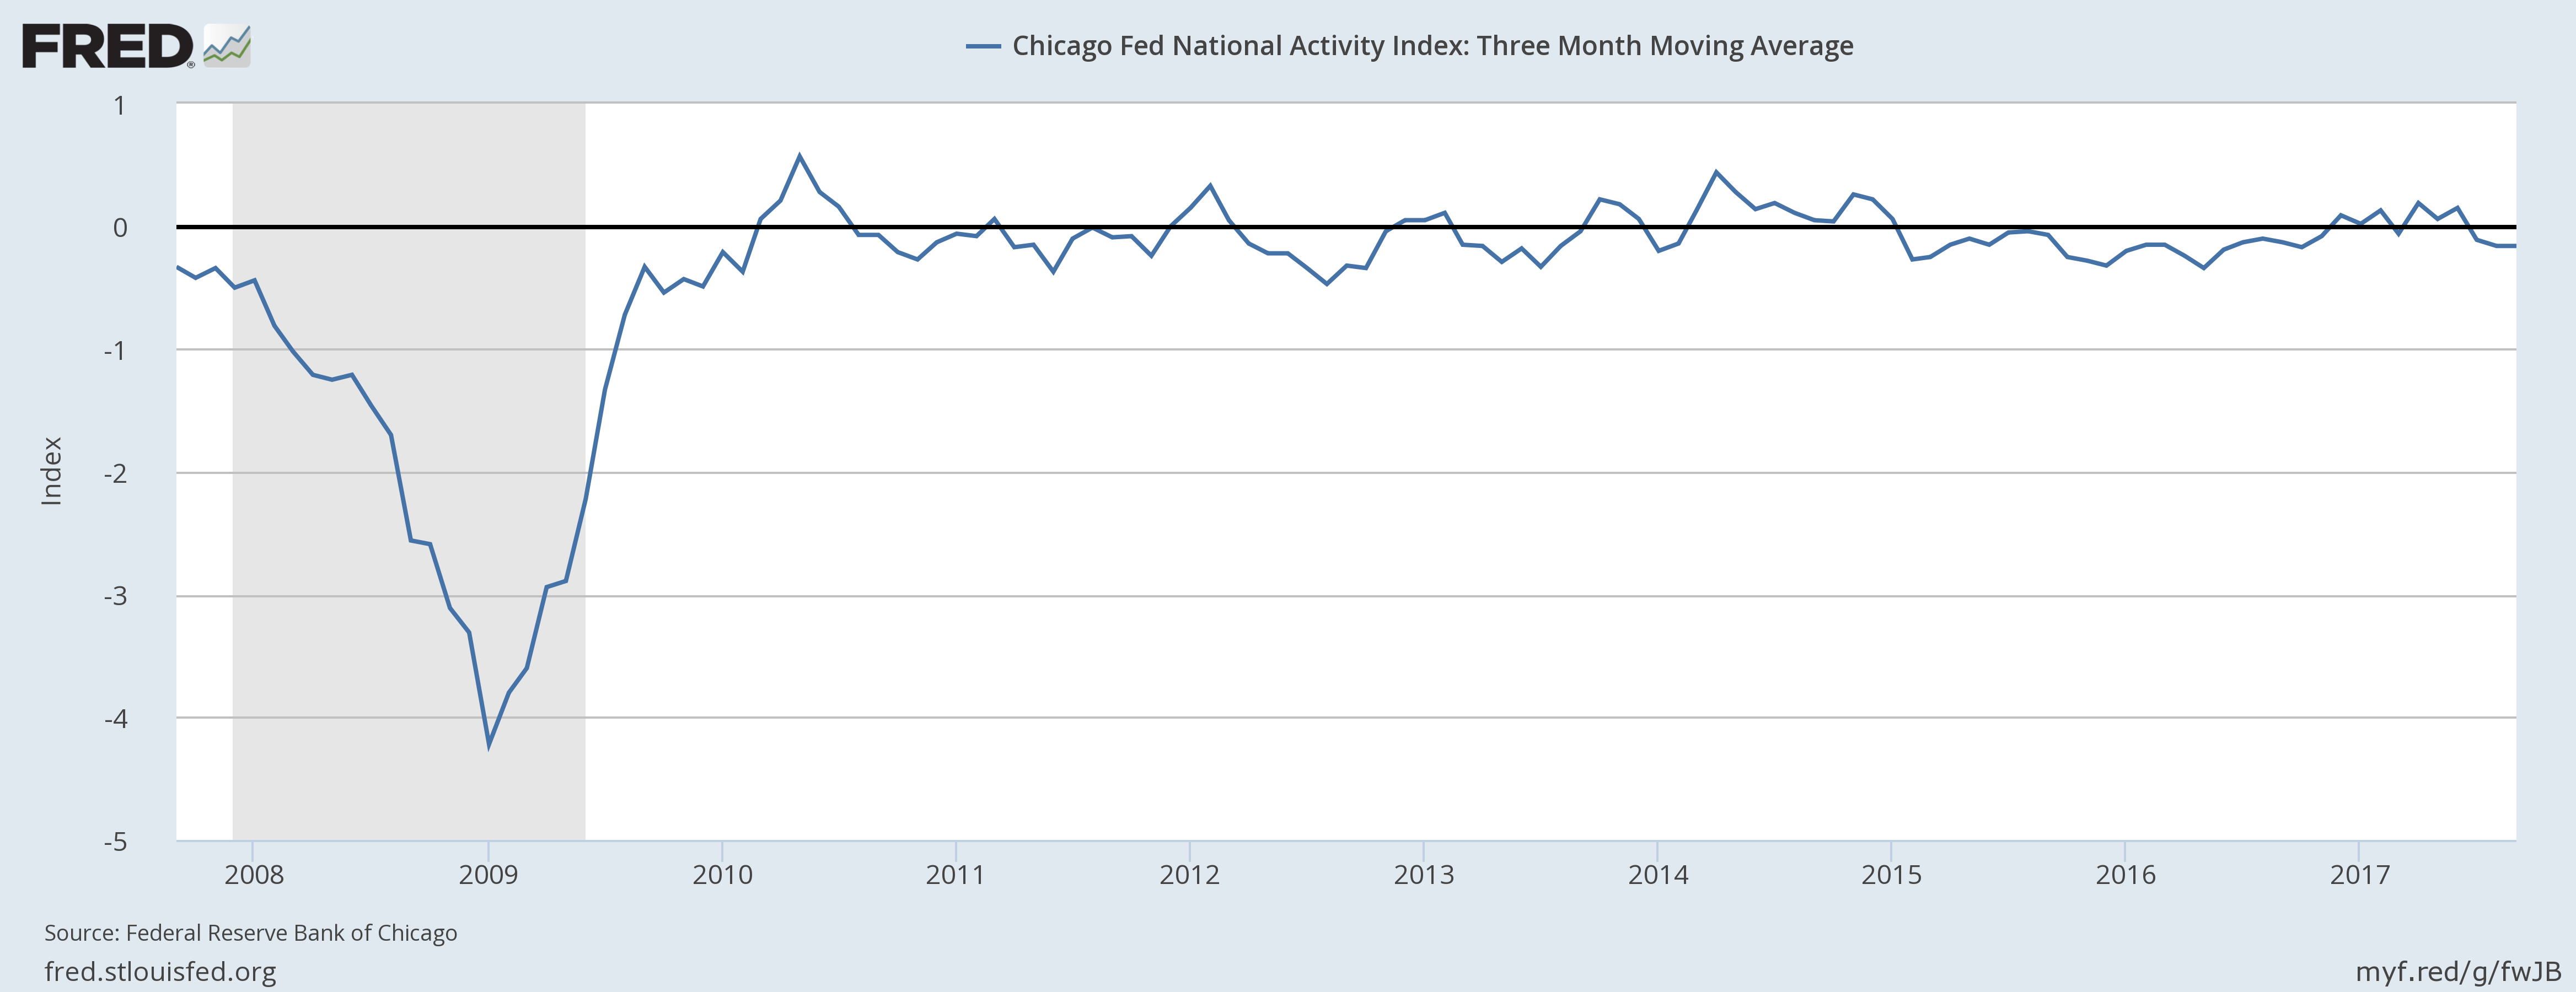
In general, readings above O indicates above-average growth while those below 0 indicate below average growth.

Related Posts
 SEC is ‘open to discussion’ when it comes to crypto: Kraken chief lawyer
 GBP, EUR And USD – The Stars Of The Week – Credit Agricole
 Insider Weekends – February 14, 2016-Edition 295
 What Blows Up First? Part 5: Shale Oil Junk Bonds
 Gold Forward Rates Plunge
- Week In Review: China Resource Plans $1 Billion Hong Kong IPO


Leave A Comment