
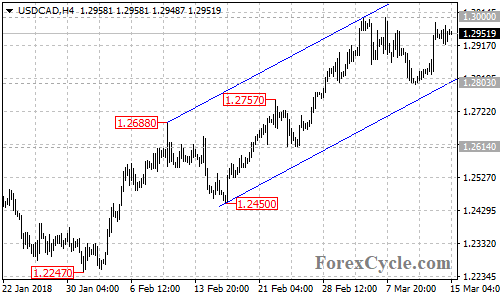
USD/CAD is testing the resistance at 1.3000. A breakout of this level would indicate that the upside movement from 1.2450 has resumed, then further rise towards 1.3100 area could be seen. Support is at the bottom trend line of the price channel on the 4-hour chart, only a clear break below the channel support could signal completion of the uptrend.

Related Posts
 No Wagering – Financial Review
- Startup Raises $133 Million To Build A Stable Cryptocurrency
- USDCAD Daily Analysis – Monday, April 16
 ECRI’s WLI Growth Index Rate Slowing Continues
 S&P 500 Snapshot: A Couple Of Headfakes Before A Flat Finish
 UK, France GDP Weaker Than Expected: Global Slowdown? IMF Early Warning Signal!


Leave A Comment