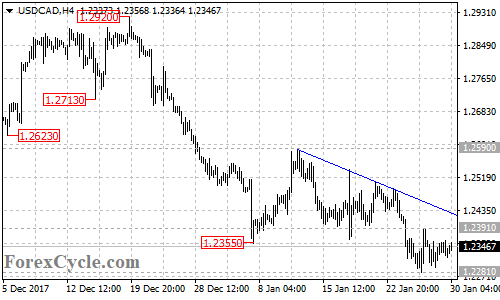
USD/CAD moved sideways in a trading range between 1.2281 and 1.2391. The sideways move is likely consolidation of the downtrend from 1.2590. Further decline would likely be seen and a breakdown below 1.2281 support could take price to 1.2200 area. The key resistance is located at the falling trend line on the 4-hour chart, only a clear break above the trend line resistance could bring price back into 1.2500 zone.
Top Entertainment
- U.S. Cereal Company, Post Holdings Inc., Buying Weetabix Ltd. For $1.8 Billion
- USD/JPY Making A Bullish N Pattern Through Chuvashov Fork
- Fast Fashion Has Changed The Industry And The Economy
- Coca-Cola’s BodyArmor Deal Seen As Negative For Pepsi, Keurig Dr Pepper
- Bank Of Japan’s ETF Holdings Surge 80% To Cartoonish 16,000,000,000,000 Yen
Search
New Posts
Cocoa Commodity Elliott Wave Technical Analysis – Monday, May 6
European Stocks Edge Higher Amid ECB Rate Cut Prospects And Mixed US Jobs Data
Was April’s Correction Noise Or Signal For Global Markets?
Wisetech Global Limited – WTC Stock Analysis & Elliott Wave Technical Forecast – Monday, May 6
Weekly Market Pulse: What Did He Say?
Leave A Comment