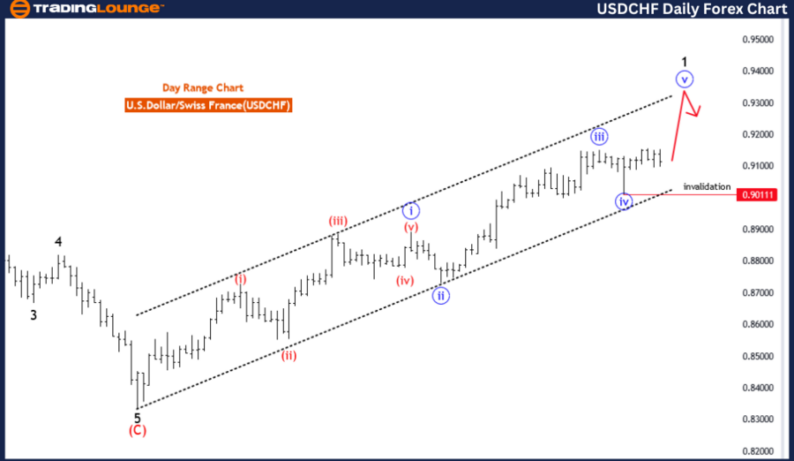
USD/CHF Elliott Wave Analysis Trading Lounge Day Chart,U.S.Dollar/Swiss Franc (USD/CHF)?Day Chart USD/CHF Elliott Wave Technical Analysis FUNCTION: Trend MODE: impulsive STRUCTURE: blue wave 5 POSITION: black wave 1 DIRECTION NEXT HIGHER DEGREES:blue wave 5(continue) DETAILS:blue wave 4 of 1 looking completed at 0.90111,now blue wave 5 of 1 is in play . Wave Cancel invalid level: 0.90111The USD/CHF Elliott Wave Analysis for the Day Chart provides an overview of the anticipated movements within the Elliott Wave structure, focusing on the prevailing trend, impulsive behavior, and key levels where shifts in market direction may occur.### FunctionThe analysis identifies the function as “Trend,” indicating that the market is displaying a consistent directional movement. This suggests that traders should be focused on identifying trends and following them to maximize opportunities.### ModeThe mode is described as “impulsive,” indicating rapid, strong movements within the wave structure. This suggests that the current phase is characterized by substantial momentum, which is typically seen in strong trending markets.### StructureThe structure is defined as “blue wave 5,” representing the fifth and final wave in an impulsive sequence. This stage typically marks the culmination of a broader upward or downward trend before a corrective phase ensues. ### PositionThe position is noted as “black wave 1,” indicating the starting point of a new cycle within the larger structure. This position aligns with a fresh beginning after the completion of a corrective phase or a significant market shift.### Direction for the Next Higher DegreesThe expected direction for the next higher degrees is “blue wave 5 (continue),” which suggests that the ongoing wave has not yet concluded and is expected to carry on. This continuation can result in significant directional movement.### DetailsThe details offer deeper insights into the current phase of the Elliott Wave structure. Blue wave 4 of black wave 1 is seen as complete, signaling the end of a corrective phase. This completion sets the stage for blue wave 5 of black wave 1, indicating a return to impulsive behavior with robust momentum. The “Wave Cancel invalid level” is set at 0.90111, which serves as a key reference point. If the market moves past this level, it would invalidate the current wave structure and require a re-evaluation of the analysis.Overall, the USD/CHF Elliott Wave Analysis for the Day Chart indicates an ongoing trend with impulsive movements in blue wave 5. The blue wave 4 of black wave 1 has likely ended, suggesting that blue wave 5 of 1 is in play, representing strong market momentum. The wave cancel invalid level at 0.90111 is crucial for confirming or invalidating the current interpretation of the wave structure.  CHF Elliott Wave Analysis Trading Lounge 4 Hour Chart, U.S.Dollar/Swiss Franc (USD/CHF)?4 Hour Chart USD/CHF Elliott Wave Technical Analysis FUNCTION: Trend MODE: impulsive STRUCTURE: red wave 3 POSITION: blue wave 5 DIRECTION NEXT LOWER DEGREES:red wave 4 DETAILS:red wave 2 of 5 looking completed or near to end ,now looking for red wave 3 of 5 . Wave Cancel invalid level: 0.90111 The USD/CHF Elliott Wave Analysis for the 4-Hour Chart provides insights into the expected movements within the Elliott Wave structure, offering traders an understanding of the current trend, impulsive behavior, and key levels for potential market shifts.### FunctionThe function is defined as “Trend,” indicating that the market is demonstrating a clear direction, with the analysis focusing on identifying and understanding this prevailing trend.### ModeThe mode is labeled as “impulsive,” suggesting strong, directional price movements. This characteristic is often associated with sharp upward or downward moves within the Elliott Wave structure, indicative of an ongoing trend.### StructureThe structure is identified as “red wave 3,” pointing to the third wave in the broader Elliott Wave sequence. This phase typically exhibits the strongest momentum and drives the broader trend.### PositionThe position is specified as “blue wave 5,” indicating that the analysis centers on a specific sub-wave within the larger structure. This positioning typically aligns with the final phase of an impulsive wave, leading into a corrective wave.### Direction for the Next Lower DegreesThe expected direction for the next lower degrees is “red wave 4,” which generally represents a corrective phase following a significant impulsive move. This direction suggests that once the current impulsive wave concludes, the market may enter a consolidation or retracement period before the next major wave.### DetailsThe details offer more granular information about the current structure and its progression. Red wave 2 of 5 is believed to be completed or nearing its end, signaling the conclusion of a corrective phase within blue wave 5. This leads to the anticipation of red wave 3 of 5, suggesting a return to impulsive behavior with significant directional movement. The “Wave Cancel invalid level” is set at 0.90111, indicating that if the market breaches this level, it would invalidate the current wave interpretation, leading to a new analysis of the market’s direction.Overall, the USD/CHF Elliott Wave Analysis for the 4-Hour Chart points toward an ongoing trend with impulsive movement in red wave 3. This suggests a strong upward or downward momentum within the larger Elliott Wave structure, with red wave 2 of 5 either completed or close to its end, indicating the commencement of red wave 3 of 5. The wave cancel invalid level at 0.90111 acts as a key threshold for confirming or invalidating the current wave structure.
  More By This Author:Binance Crypto Price News Today; Elliott Wave Technical Analysis
Elliott Wave Analysis: Nasdaq Stocks, AAPL, AMZN, NVDA, META, NFLX, GOOGL, MSFT, TSLA.
Elliott Wave Technical Analysis: Microsoft Inc. – Friday, April 26

Related Posts
 EUR/USD: Euro Rising On The Back Of A Retreat To Safe Havens
 Euro Extends Pullback
 US GDP Highest Growth Rate In 4 Years
- 3 Things: Earnings, Profits, Rates
 Chinese Stocks Open Down Hard As PBOC Strengthens Yuan By Most Since 2010 & Default Risk Hits 2-Year High
 Continuing To Favor U.S. Large Cap Stocks Over U.S. Small Cap Stocks


Leave A Comment