Wage Growth – Is It Accelerating?
Wage Growth – In my last post I gave an overview of the August labor report. I’ll fill in the details with this article. ECRI has been negative on economic growth since late 2017.
There was some slowness in Q1, but that was reversed in Q2 as growth was 4.2%. It has been completely wrong to be negative on U.S. growth as America has outperformed other advanced economies.
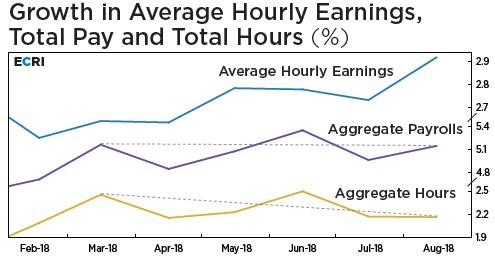
This gives context to the ECRI chart below which shows average hourly earnings growth, aggregate payroll growth, and aggregate hours worked growth.
Even though this shows 3 stats in one chart with 3 different y axes, I don’t think this is a chart crime.
However, I disagree with the interpretation of the data. I always discuss how take home pay is important which is why I look at weekly earnings growth.
The analysis from ECRI agrees that take home pay is important, but claims growth is weak which is incorrect based on an objective look at the data.

This chart shows hourly earnings growth is quicker than hours worked growth which means pay growth is in the middle. It’s not as weak as the growth in total hours worked and not as strong as hourly earnings growth.
However, we shouldn’t act as if payroll growth is weak, just because it is slightly off the high made in June. The weekly earnings growth for August was 3.2% which was above July’s growth of 3%.
The cycle high is 3.4%, showing us how strong take home pay growth was. Regardless of whether the ECRI’s negative prediction for the economy is correct, I will continue to follow it to understand both sides of the debate.
Wage Growth – Multiple Job Holders
Heading into the jobs report I was wondering if it would have a bad headline which would be revised higher.
That’s because in the past 5 years the average initial report was 158,000. Yet the average positive revision of 38,000 brought the average to 196,000.
It’s still possible the report will be revised higher, but it started great which was different from the average.

Related Posts
 How To Trade Double Calendars And Double Diagonals On GS
 Why Investors Go To Copper As An Inflation Hedge
- Setups And Trade Ideas For Next Week
- Stocks: Really Big Moves Still Ahead?
 WTI Crude Oil And Natural Gas Forecast – Thursday, April 19
 Fixing FDR’s Biggest Blunder: From Gold Standard To Fiat Folly And Back


Leave A Comment