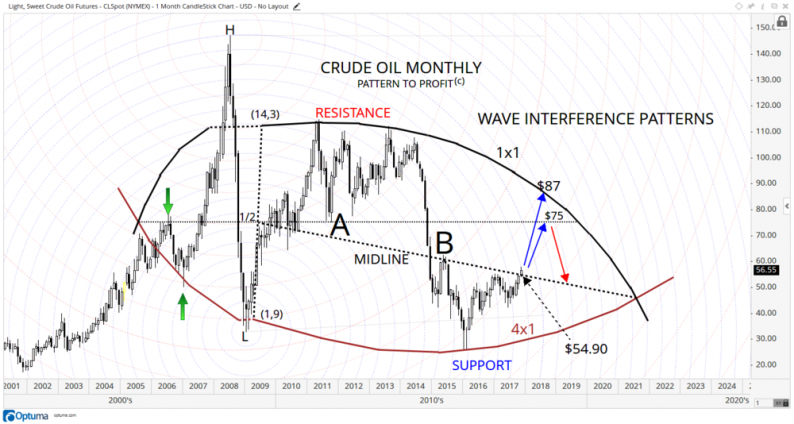
CRUDE OIL (CL SPOT)
On November 3, crude oil broke above resistance of $55.24 from the high of the first week of this year. Perhaps even more important is the simultaneous breakout of resistance at the confluence of two wave interference patterns:
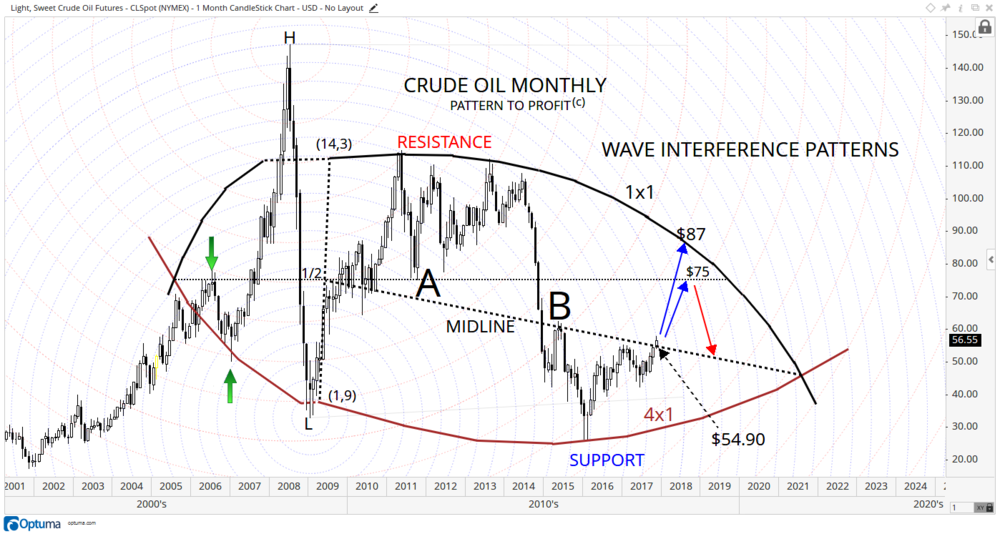
Wave interference patterns are generated from the intersection of two (or more) sets of concentric circles interacting (emanating, usually from an important reversals), akin to dropping two stones into a pond.
The line patterns shown here (solid lines) are made by connecting such intersections using specific relationships: 1×1 (black) and 4×1 (brown). Although line patterns can start anywhere, the examples shown are selected due to their alignment with price.
While crude is still recovering from the major low of Jan./Feb. 2016, formed at the 4×1 pattern (brown), this month it managed to cross above resistance at $54.90, from the critical mid-line (black dashed angle). Note previous resistance from this mid-line at point B, causing the final leg of the downtrend to support. However, the month is only half-finished. Time will tell if the month closes above $54.90.
Note the double-top at the black resistance pattern of 1×1, whose continuation downward shows potential resistance around $75-$87, at the time the current market may reach it. But, the $75 price level of the 1/2 point (dashed black horizontal) stands in the way of a full recovery back up to the resistance curve. Notice its prior effectiveness as support at point A.

Related Posts
 October 2018 Chicago Purchasing Managers Barometer Eases With Softer New Orders, Backlog
 USD/CAD Daily Analysis – Friday, Oct. 12
 Billary Buddy Marc Lasry’s Last Rodeo—The Jig Is Up On 25 Years Of Bottom Fisher Bailouts
 Why The Big Banks Want Higher Interest Rates
 Crypto ATM firm Bitcoin Depot will go public on Nasdaq starting July 3
 EURUSD: Outlook Remains Lower With Eyes On Key Support


Leave A Comment