The economic calendar is heavy. In the battle of competing explanations for the market declines, the inflation story has taken center stage. With both PPI and CPI scheduled for release this week, I expect many to be asking:
Will rising inflation spark another leg down for bonds and stocks?
Last Week Recap
My last edition of WTWA will go down as a personal favorite. My objective is to help investors plan for what might be coming. Reacting is always easier if you have a plan. If you read last week’s installment, you should not have been surprised by anything that happened during the week. Many of the best investment minds were on TV or writing during the week, emphasizing the continuing sound fundamentals. They were correct, of course. I hope that readers were able to prepare in advance, understanding the unfolding events.
Now if I can only do half as well in the week ahead!
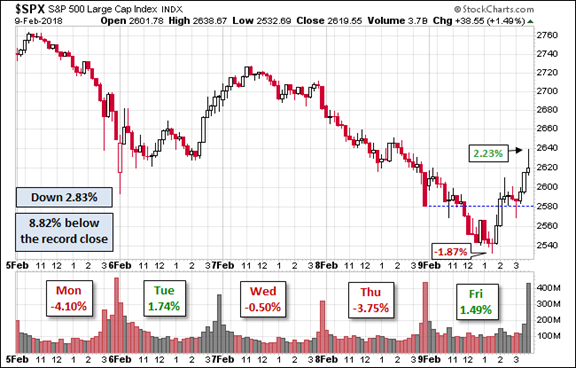
The Story in One Chart
I always start my personal review of the week by looking at a great chart. I especially like the Doug Short design with Jill Mislinski updates and commentary. You can see many important features in a single look. She includes not only the price changes, but also volume and helpful callouts. The entire post includes a great collection of charts and analytical observations.

The decline for the week featured a 9% trading range! Remember all those weeks when the range was only 1%? It was a time of abnormal behavior – a long time. A 9% move is also abnormal. The long-term average for the VIX is 19.
A key question is how long the current decline might last, and how large it could be. As a starting point, this history of drawdowns over the last ten years is quite helpful, especially given last week’s action.

Drawdowns of 5-10% are completely routine, often occurring several times a year. The last two years have been quite unusual.
A Good Question from Eddy
Eddy Elfenbein is the best at finding key points and explaining them effectively. I subscribe to his feed and follow him on Twitter. He asks, is this a good time to buy? He cites many of the comments we all hear right now. (Answer at the end of today’s post).

The News
Each week I break down events into good and bad. For our purposes, “good” has two components. The news must be market friendly and better than expectations. I avoid using my personal preferences in evaluating news – and you should, too!
The economic news remains very positive, despite the reaction of the markets this week. New Deal Democrat’s weekly comprehensive indicator update should satisfy even the nerdiest observer. I read it every week. Here is his conclusion for this week:
It is important this week to emphasize that I use this information for forecast the economy, not the stock market. Stocks were melting up at a 48% annual rate since the beginning of September, so even the 10% correction this week, they did not make a 3 month low! Thus they remain a positive in this forecast. Aside from several long leading indicators, the only other weak spots were steel and rail carloads.
The Good


The Bad

The Ugly
This week’s ugly award goes to the short volatility products. These were supposed to provide consistent modest growth. Investors looking at past performance would have seen no reason for alarm. Individual investors lost 80-90% in the collapse and closing of these products. Many probably did not understand what they were buying.
But we all were affected by the ripples. Hedge funds were big players and used leverage to magnify the modest gains. Robin Wigglesworth (The FT) provides a good explanation.

Related Posts
 Crude Tumbles As Inventories Surge For 10th Week In A Row And Production Rises Despite Demand Drop
 Why Facebook Is Not A Great Investment Option Now
 Valuations Pass The 1929 Bull Market Peak
- Dimension Therapeutics Downgraded To Neutral From Buy At Goldman
- The Myth Of Market Liquidity Will Make The ’87 Crash Look Like A Day At The Beach
 Self-custody isn’t for everyone: WisdomTree exec on ‘be your own bank’


Leave A Comment