History Helps With Flexibility
Since the S&P 500 recently completed a very rare period of V-bottoms, it is easy to visualize and understand the “rapid bottom and push to new highs” case for stocks. Recency bias tells us we may have pushed other historical examples to the side.
Humans Act In Similar Ways
Since it is important we remain flexible and open to all outcomes, the charts below can help us with the “what if stocks do not bottom for weeks or months” scenarios. The charts below can also help us better identify patterns and candlesticks that may appear during a correction and subsequent bottoming process.
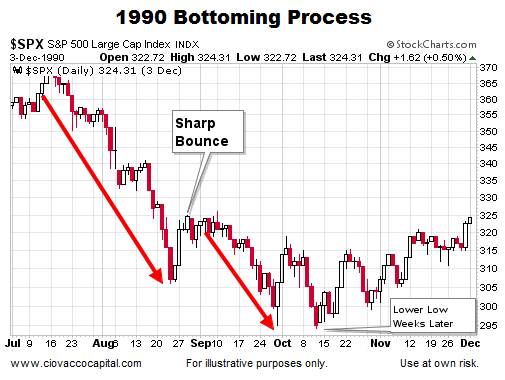
1990 – “U Can’t Touch This”
In 1990, MC Hammer was near the top of the charts. Stocks were on the lower end of the charts, peaking in July and then making a series of lower lows before finding a bottom.

1994 – “All I Wanna Do”
Sheryl Crow reminded us to stop and smell the roses. The stock market smelled nothing like roses, making a low in early April. Equities did not turn up convincingly until mid-May.

1997 – “Staring At The Sun”
U2’s big 1997 hit required respect for your corneas. Stocks also required a “look away” period, dropping significantly between mid-March and mid-April. Several “green days” were mixed in for confusion purposes.

1998 – “Time Of Your Life”
Green Day’s 1998 hit would later be used in the final episode of Seinfeld. Stocks told a story about nothing, correcting in an up and down manner for almost three months.

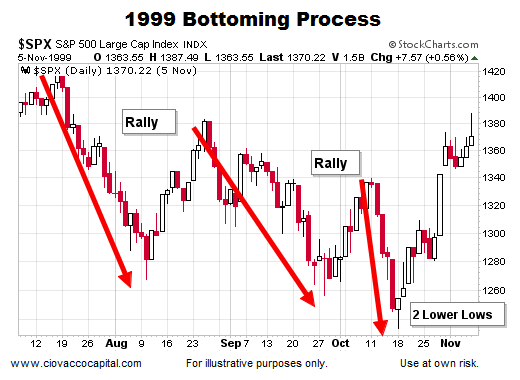
1999 – “Cowboy”
In 1999, a guy from Detroit said he “wanted to be a Cowboy”, which seemed a bit odd. Stocks were dealing with an odd fear about computers crashing at midnight on December 31. Many countertrend rallies were fully retraced before a final low was made.
2004 – “Are You Gonna Be My Girl?”
A band named Jet asked an age old question. Stocks were a mess, making three lower lows during an established daily downtrend.


Leave A Comment