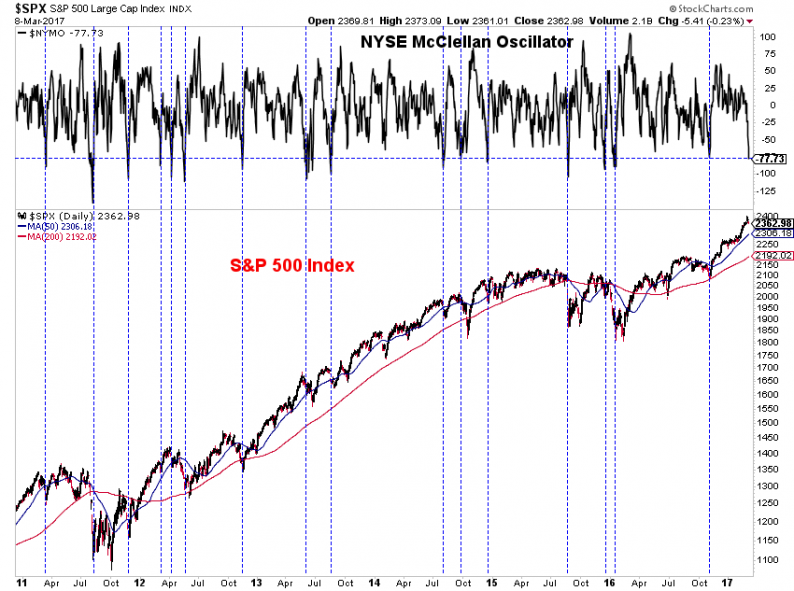
The NYSE McClellan Oscillator (aka NYMO) is at its most oversold level since last November (in the correction just prior to the election).

With data going back to 1998, the current level (-77.73) is more oversold than 98% of other days. Historically, such extreme oversold levels have been followed by above-average returns over the next 1-12 months.

Does that mean the stock market always bounces when NYMO is oversold? No, there is no holy grail in markets and no such thing as always. You simply have a higher probability of a positive forward return than when the market is not extremely oversold.

There have been a number of times when an oversold NYMO reading was followed by a negative 12-month return. We saw this in 2001, 2007, 2008, and most recently, in 2014.

The September 2014 oversold data point was the only one since March 2009 that was followed by a negative 12-month return. The other 57 instances were all positive, followed by an average 12-month return of 21.1%.

The question, of course, is whether this going to play out like the 2007 data points or the many positive examples in recent years.
Unfortunately, that is question without an answer, because we cannot predict the future. The best we can say is that extreme overbought conditions in the McClellan Oscillator tend to lead to above-average forward returns with a higher probability of a positive short-term outcome than other periods. But these are just probabilities – there are many exceptions (most notably data points in 2001, 2007, and 2008).
Will the current reading fall into the “tend to” category or the “exception category”? We’ll only know in hindsight.


Leave A Comment