
AT40 = 67.2% of stocks are trading above their respective 40-day moving averages (DMAs) – ended 12 straight days overbought
AT200 = 60.3% of stocks are trading above their respective 200DMAs
VIX = 10.0
Short-term Trading Call: bullish
Commentary
On Monday, the S&P 500 (SPY) went into a bearish divergence with AT40 (T2108), the percentage of stocks trading above their respective 40-day moving averages (DMAs). However, I explained why I decided to keep the trading call on bullish…and things worked out. On Friday, the S&P 500 gapped up to a fresh all-time high.
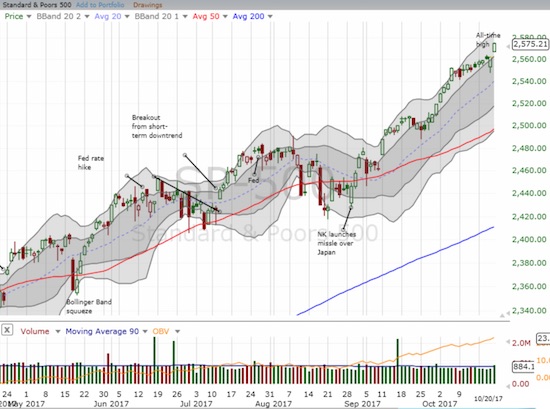
The S&P 500 managed to preserve its uptrend within its upper Bollinger Band (BB) channel. The index gapped up to a fresh all-time high on a gain of 0.5%.
AT40 closed at 67.1%, its first daily gain in 6 trading days. When the S&P 500 gapped down on Thursday, I started to wonder whether a confirmation of On Monday was underway. Buyers quickly dismissed such concerns as they immediately bought the gap and never looked back (see the chart above). The gap down was a bit mysterious, but I suppose the 30-year anniversary of the 1987 stock market crash provided a convincing driver to some traders.
Don’t call it a crash, it’s a correction…
Other key indices provided good confirmation of the continuation of bullishness.
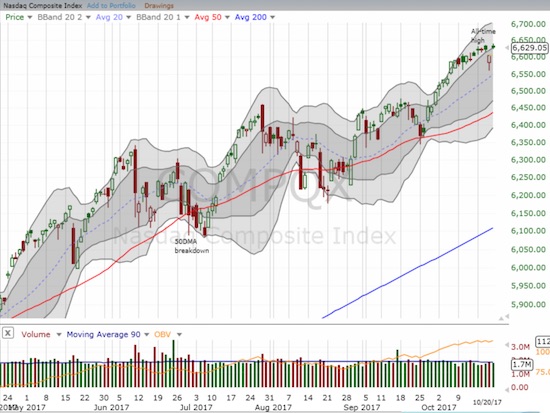
The Nasdaq quickly left behind Thursday’s sudden blip downward.
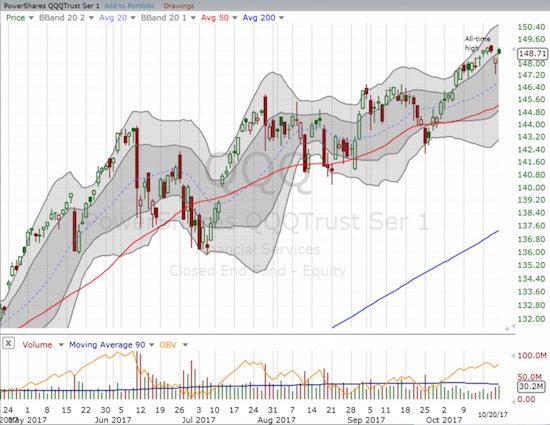
The PowerShares QQQ ETF (QQQ) also left Thursday’s sellers stranded but did not quite recover the all-time high.
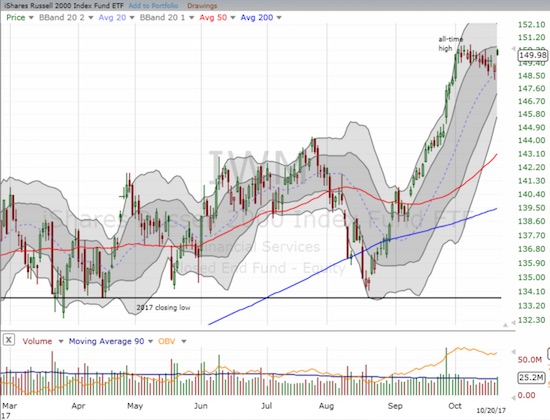
The iShares Russell 2000 ETF (IWM) gapped higher to a small, bullish breakout from the recent drift downward.
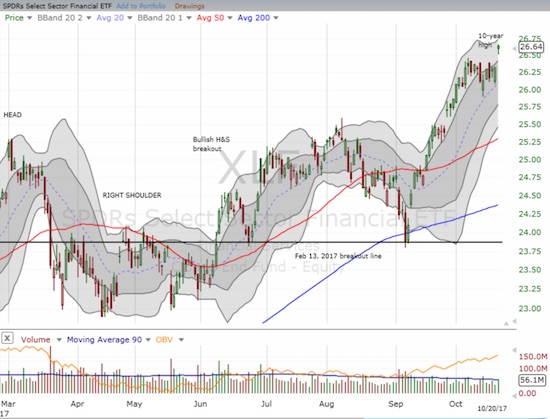
The Financial Select Sector SPDR ETF (XLF) made definitive declaration of bullishness with a gap up to a new 10-year high.
The volatility index, the VIX, experienced yo-yo kind of trading the past two days. Volatility traders went right to work after the stock market opened with a gap down. On Friday, volatility sellers were unable to hold the VIX close to its all-time low.


Leave A Comment