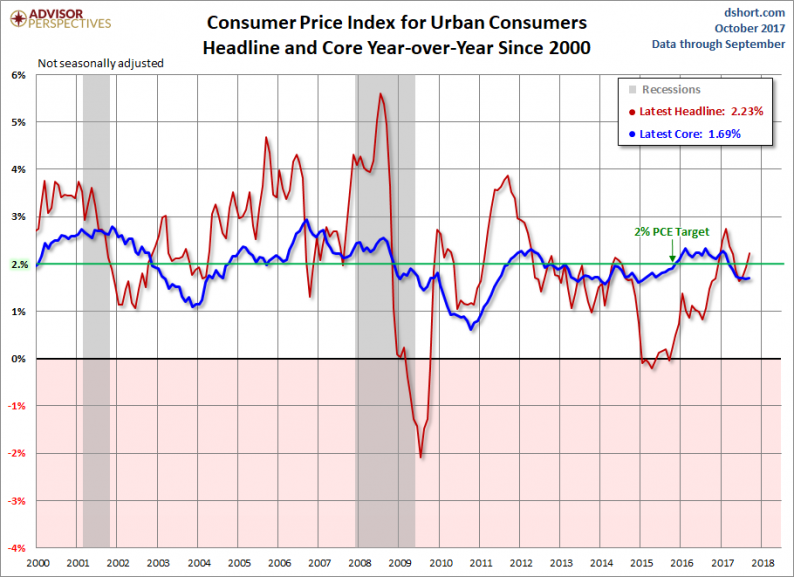
The Bureau of Labor Statistics released the September Consumer Price Index data this morning. The year-over-year non-seasonally adjusted Headline CPI came in at 2.23%, up from 1.94% the previous month. Year-over-year Core CPI (ex Food and Energy) came in at 1.69%, up fractionally from the previous month’s 1.68%.
Here is the introduction from the BLS summary, which leads with the seasonally adjusted monthly data:
The Consumer Price Index for All Urban Consumers (CPI-U) rose 0.5 percent in September on a seasonally adjusted basis, the U.S. Bureau of Labor Statistics reported today. Over the last 12 months, the all items index rose 2.2 percent.
The gasoline index increased 13.1 percent in September and accounted for about three-fourths of the seasonally adjusted all items increase. Other major energy component indexes were mixed, and the food index rose slightly.
The index for all items less food and energy increased 0.1 percent in September. The shelter index continued to increase, and the indexes for motor vehicle insurance, recreation, education, and wireless telephone services also rose. These increases more than offset declines in the indexes for new vehicles, household furnishings and operations, medical care, and used cars and trucks.
Hurricane Irma had a small impact on data collection in September. Data collection was affected in some areas in Florida.[More…]
Investing.com was looking for a 0.6% increase MoM in seasonally adjusted Headline CPI and 0.2% in Core CPI. Year-over-year forecasts were 2.3% for Headline and 1.8% for Core.
The first chart is an overlay of Headline CPI and Core CPI (the latter excludes Food and Energy) since the turn of the century. The highlighted two percent level is the Federal Reserve’s Core inflation target for the CPI’s cousin index, the BEA’s Personal Consumption Expenditures (PCE) price index.

The next chart shows both series since 1957, the year the government first began tracking Core Inflation.


Leave A Comment