
The EUR/USD hit monthly highs on Tuesday but lost 1.1700 as the US Dollar found its feet. What’s next?
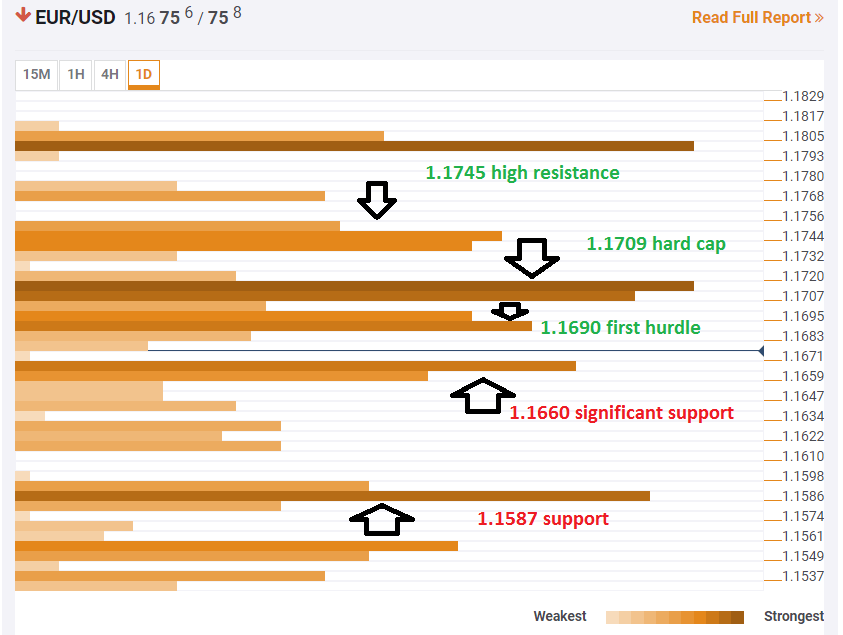
The Technical Confluences Indicator shows that the pair is struggling with 1.1690, which is the convergence of the Bolinger Band 15m-Lower and the Fibonacci 61.8% one-day.
If the EUR/USD overcomes this immediate cap, it faces a more substantial cap at 1.1709 which is the Simple Moving Average 5-4h, the Fibonacci 38.2% one-day, and the Fibonacci 38.2% one-month.
The next hurdle is not that far off, at 1.1745, which is the confluence of the Fibonacci 23.6% one-month, the BB one-day Upper, and the BB 4h-Upper.
Looking down, 1.1660 can provide immediate support: it is the meeting point of the Fibonacci 61.8% one-month, the Pivot Point one-day Support 1, and the one-day low.
The next considerable cluster of support is only at 1.1587 which is the convergence of the Fibonacci 23.6% one-week, the SMA 200-4h, the PP one-day Support 3, and the PP one-month one-month Support 1.
Here is how it looks on the tool:
Confluence Detector
The Confluence Detector finds exciting opportunities using Technical Confluences. The TC is a tool to locate and point out those price levels where there is a congestion of indicators, moving averages, Fibonacci levels, Pivot Points, etc. Knowing where these congestion points are located is very useful for the trader, and can be used as a basis for different strategies.
This tool assigns a certain amount of “weight” to each indicator, and this “weight” can influence adjacents price levels. These weightings mean that one price level without any indicator or moving average but under the influence of two “strongly weighted” levels accumulate more resistance than their neighbors. In these cases, the tool signals resistance in apparently empty areas.


Leave A Comment