This week will be the first week where earnings start to flow in quicker. So far, as of July 13th, 30 firms have reported earnings. Of the 30, 24 beat, 3 matched, and 3 missed estimates. An 80% beat rate is very high, but it’s too early to call it a signal for how the quarter will play out. Certainly, the estimates are high. Only 4.81% sales growth is expected, but in terms of profitability Q2 should be amazing. At $116.34, trailing twelve-month operating earnings are expected to reach their all-time high. At $105.04 trailing-twelve month as reported earnings will miss their all-time high by 92 cents. As I have previously discussed, the margin improvement is driving this profit growth as margins are expected to be 10.40% which is 0.30% higher than the Q3 2014 peak. I don’t expect margins to get much higher as I see deceleration in sequential margin growth starting in Q3 partially because of energy weakness.
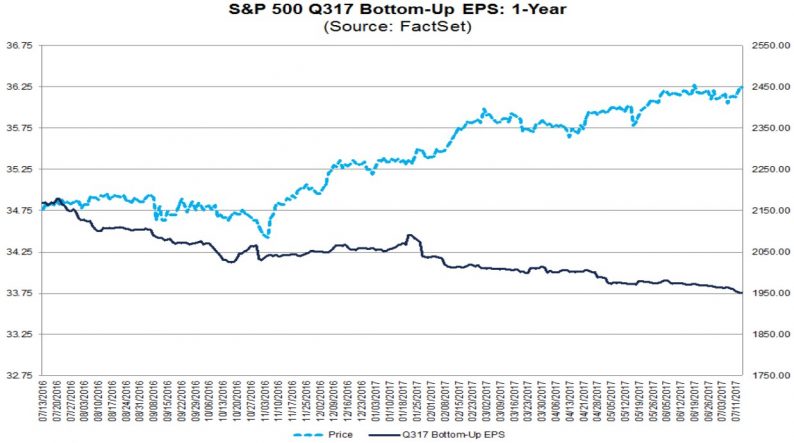
My below consensus expectations begin in Q3. Interestingly, even though only 1 out of 6 firms has issued negative guidance for Q3 and 80% of firms have beaten estimates, the bottom-up EPS estimates for Q3 have fallen recently as you can see at the right end of the chart. In the past year, Q3 estimates have fallen over a dollar. In Q3, earnings are expected to be up 7.1% and sales are expected to be up 5.0%, meaning sales growth is expected to accelerate and margin growth is expected to slow. That estimate is the starting point, meaning it will likely come in over the next few weeks making Q3 have less robust growth than the prior two quarters. Energy earnings still have 3 quarters of easy comparables (including this quarter) as Q2 earnings are expected to be up 357.4% year over year.

Timing the business cycle will help us predict when the earnings growth trend will end. I have expressed many times what the blue line in the chart below shows. The ratio of corporate debt to GDP is near its all-time high. I am open to the fact that I may be interpreting this information wrong. A potential mistake with this chart is that businesses can grow profits faster than GDP because of international sales. I wouldn’t even compare corporate growth to global GDP growth because U.S. firms can take market share from global competitors. These factors make this chart less predictive of a recession than I initially stated. If you say that corporate debt to GDP will peak at the same rate as 2008, you are saying this multi-decade trend of rising corporate debt to GDP will end. The orange line is a better way to measure the cycle. In using the 10-year average, it has captured the timing of previous cycles turning. Currently we aren’t near a turn according to this metric.


Leave A Comment