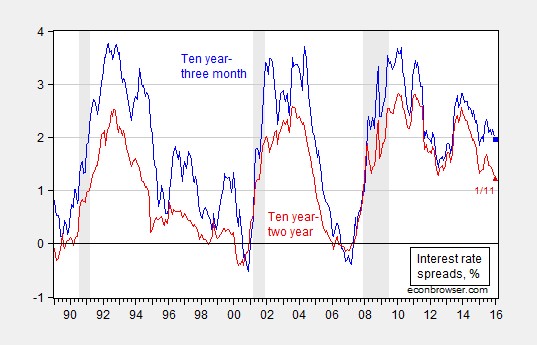
Since we’re talking recession, it’s of interest to see what market indicators are saying, for the US and for the world. First, the term spread for the US:

Figure 1: Ten year-three month spread (blue), and ten year-two year spread (red). January observation is for 1/11. NBER defined recession dates shaded gray.
Source: Federal Reserve Board via FRED, NBER, and author’s calculations.
The inversion of the yield curve which typically precedes a recession (at least over the post-War era) has not appeared. We can assess the likelihood more formally.
Using the probit regression estimate (equation 3, Table 5) in Chinn-Kucko (2015), one can obtain an estimate of the probability of a recession in the next twelve months.
Prob(Recession=1) = -0.27 -0.69 × spread
Pseudo-R2 = 0.38, NObs = 519, Sample = 1970-2013.
Using the spread value of 1.96 ppts for January 11, the implied probability of recession is 5%.
Some discussion has focused on credit spreads. The Moody’s BAA-Treasury spread and TED spread (for measuring liquidity) is shown in Figure 2.
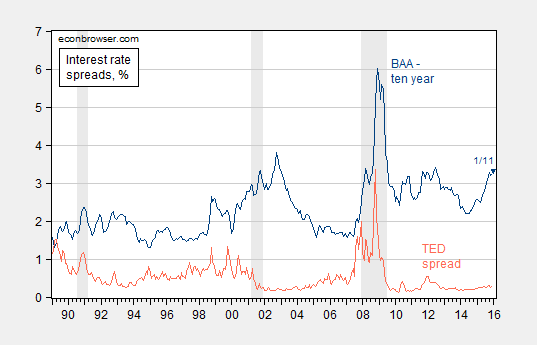
Figure 2: Moody’s BAA corporate bond-ten year Treasury spread (dark blue), and LIBOR-3 month Treasury (TED) spread (orange). January observation is for 1/11. NBER defined recession dates shaded gray.
Source: Federal Reserve Board via FRED, NBER, and author’s calculations.
While the BAA-Treasury credit spread is elevated, especially relative to the 1990’s and 2000’s, the spread has been trending upward over time (2.7 bps/year from 1953-2007). In any case, credit spreads are typically considered contemporaneous, rather than leading, indicators of recession.
Finally, what about term spreads around the globe?

Figure 3: Ten year-three month term spreads, as of 1/6/2016 (blue bar). China observation is Five year-three month term spread. Euro ten year rate is for Germany.
Source:Economist January 9th edition, and author’s calculations.


Leave A Comment