
The S&P 500 (SPY) is UP year-to-date 0.2%. That does not sound like much for mid-March, but consider from whence we came…The S&P 500 (SPY) has finally reversed all its losses for the year just as it has printed a bullish breakout above 200-day moving average (DMA) resistance.
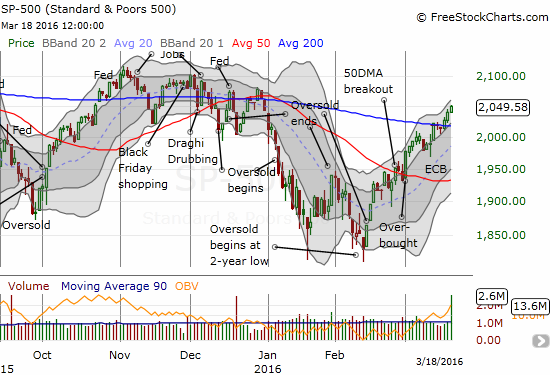
The S&P 500 (SPY) has now closed three straight days with gains above its 200DMA. The last 200DMA breakouts occurred from October through December and turned out to be false breakouts. Those breakouts were accompanied by deteriorating technicals and carried lots of warnings that I chronicled in the T2108 Updates at that time. The technicals this time around are strengthening; a broad swath of stocks are participating in the fun. This rally is a different kind of breakout.
T2108, the percentage of stocks trading above their 40-day moving averages (DMAs), is overbought (greater than 70%) but is holding firm at 87.1%, a 5-year high. T2108 has been overbought for 14 days. The stock market is just over a week away from hitting the overbought tipping point where an extended overbought rally has historically launched.
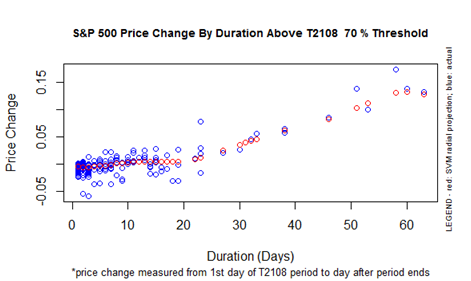
S&P 500 Performance By T2108 Duration Above the 70% Threshold
Even more importantly, T2107, the percentage of stocks trading above their 40-day moving averages (DMAs), is still increasing. It closed at 43.3%, an 8-month high.

The momentum behind the rally remains strong as more and more stocks are trading above the critical long-term 200DMA.
So THIS 200DMA breakout for the S&P 500 is much different than the others. The technicals are strong and actually improving. I will of course reassess the situation if T2108 starts declining, T2107 stalls, and/or especially if the S&P 500 closes below its 200DMA. Surprisingly, the Australian dollar is STILL struggling to break 200DMA resistance against the Japanese yen, so that indicator continues to flash a mild warning. AUD/JPY keeps my trading call at cautiously bullish.


Leave A Comment