
The yen sparkled this week, as USD/JPY dropped 170 points last week. The pair closed the week at 108.55, as the yen climbed to 5-month highs. There are just four releases this week. Here is an outlook for the highlights of this week and an updated technical analysis for USD/JPY.
The yen took advantage of soft US consumer numbers, as CPI and retail sales reports missed their estimates. As well, flash-points in North Korea and Syria spooked investors, who snapped up the safe-haven Japanese yen.
Updates
USD/JPY graph with support and resistance lines on it. Click to enlarge:
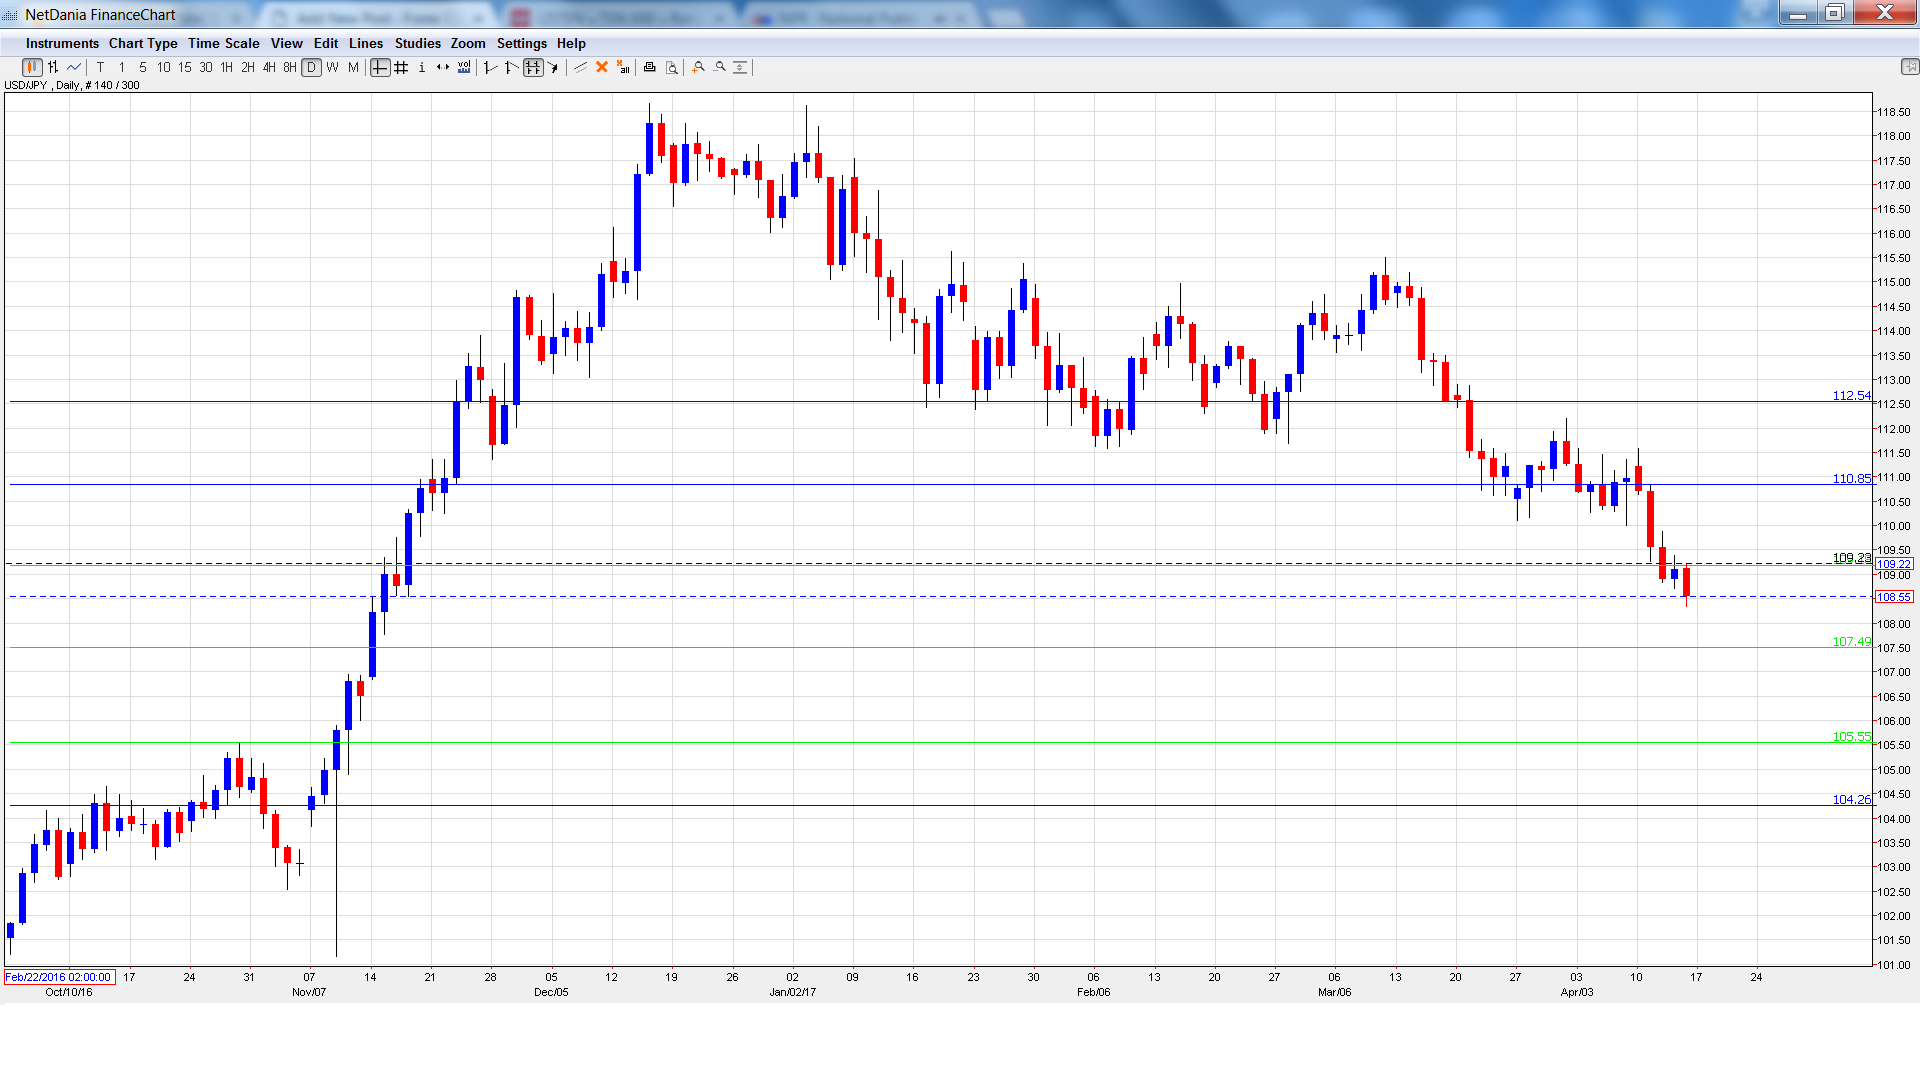
USD/JPY opened the week at 111.21. The pair quickly climbed to a high of 111.58, and then headed lower, dropping to a low of 108.35, breaking below support at 109.18 (discussed last week). The pair closed the week at 108.55.
Live chart of USD/JPY:
Technical lines from top to bottom:
112.53 has held in resistance since mid-March.
110.83 is next.
109.18 marked the start of a rally in September 2008 which saw USD/JPY drop close to the 0.87 level.
107.49 was a cap in July 2016.


Leave A Comment