
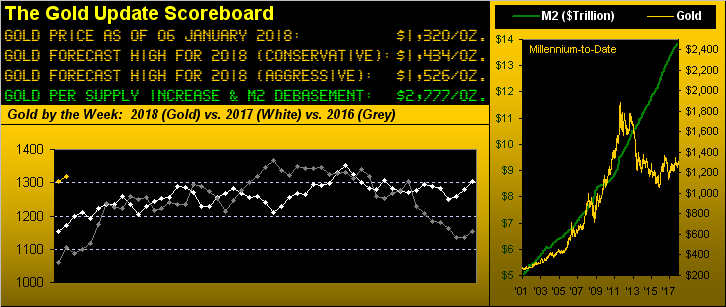
A new year and a new look for the above Gold Scoreboard, incorporating both our conservative and aggressive forecast highs for 2018. Also at right, we’ve added that which we’ve often referred to as “Gold’s most important graphic”: the millennium-to-date track of the U.S. money supply (“M2”) vs. the clearly lagging price of Gold. Quite a bit of catching up to do.
A long way to go, to be sure, but in starting the year, “so far so Gold”. Want some history? For the 44 years inclusive from 1975 into 2018, Gold’s first four trading days in each have recorded a net gain just 18 times, 2018’s being +1.2%. The other 17 such years have led to net annual gains 11 times, i.e. 65% of the time. That’s OK, but here’s the neat bit: for those same 17 years if price after four days was also higher than it was four days into the prior year — as is the case in 2018 — Gold then went on to record a net annual loss just three times (’83, ’90 & ’96). Esoteric pap perhaps, but it predominantly points to a pro-Gold run in 2018.
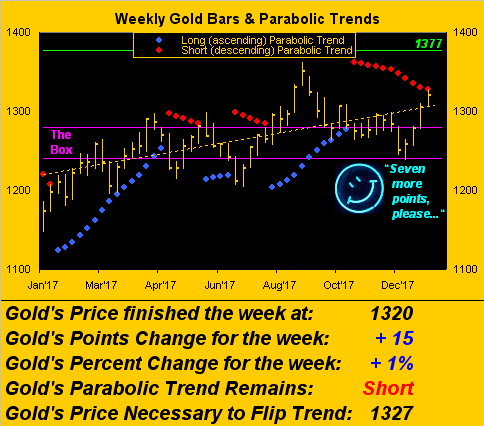
And with the year kicking into first gear, it’s time for price to up-shift through the descending red dots of weekly parabolic Short trend to flip it Long. For as the weekly Gold bars graphic shows us, we need just seven more points to the upside such that a fresh set of new blue dots can support Gold for the drive up toward Base Camp 1377. Such run would surpass last year’s high at 1362, 1377 being 2016’s peak:
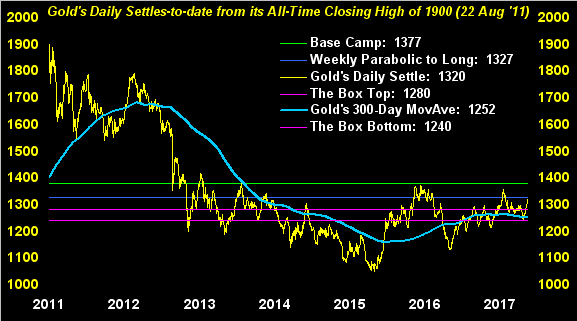
Next we’ve Gold day-by-day since its All-Time Closing High at 1900 back on August 22, 2011. ‘It’s grand to see Gold moving up and away from both its 300-day moving average as well as from the purple bounds of The Box. Again, the impetus to far higher Gold pricing is to initially get above that green line at 1377 and bid it “Adieu bébé!” Here’s the graphic:
Of course what had really been getting its due until getting “doinked” in starting the new year is the Economic Barometer. The Trade Deficit per the November reading exceeded $50 billion for the first time since March 2015 and Factory Orders missed expectations. Also missing consensus for December were the Institute for Supply Management’s Services Index and most notably the growth in the month’s payrolls. As for the stock market per the S&P 500, it kicked the year off right off the bat:


Leave A Comment