Everyone is going to be keying in on a certain trend line on Monday morning and how the market reacts around it. It doesn’t matter what type of investor you are – fundamental, technical, strategic, passive, active, whatever… When push comes to shove, everyone wants to know if the 200-day simple moving average will hold or fold.
I wrote a lengthy post last year on the 200-day moving average that I think is very important to frame the context and history of this trend line. In it, I outline several key points for to investors consider with respect to a defense or breach of this area and what it may mean for changes to their portfolio.

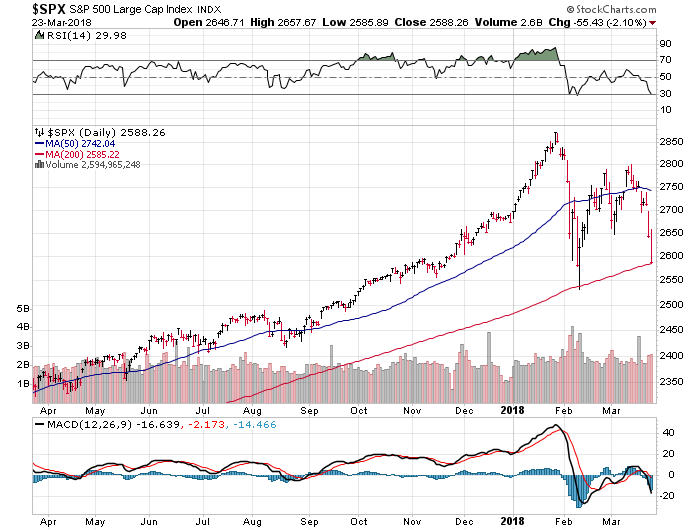
Below are my observations of the current market and what I see on the chart as of March 25, 2018:
The S&P 500 Index is starting the week down -3.2% on the year and -10% off the high. It’s right in the middle of “correction” territory in market lingo.
The 200-day moving average on the S&P 500 Index is still in an uptrend (or upslope) and is climbing at an appreciable pace. It’s roughly 50 S&P points higher than the intra-day level that was tested back in February.
Long-term averages (by definition) are slow to change. Think of it like getting a freight train or aircraft carrier moving in one direction. It takes a lot of time and energy to ultimately disrupt the current trend.
A re-test of the February intra-day low would still be considered a technical break of the 200-day moving average. I think this area is probably more important from a risk management standpoint than the trend line itself.
A successful re-test and hold of the February lows would likely be viewed as an overall bullish sign and create a more stable base of support to trade against.
The recent volatility is also shaking up other trend lines as well. The 50-day moving average is starting to roll over, which is to be expected from the series of sharp moves in both directions. This indicator is truthfully more useful for short-term traders who are in and out of the market on a more regular basis.
Speaking of volatility – this type of price action is perfectly normal and shouldn’t be viewed as a catalyst for investors to panic or pivot from their current game plan. There are plenty of times when the market whipsaws back and forth above and below the 200-day with very little rhyme or reason. Take it with a grain of salt.
There will also be significant divergences between the major indexes, individual stocks, and ETFs in how they are positioned versus their respective trend lines.


Leave A Comment