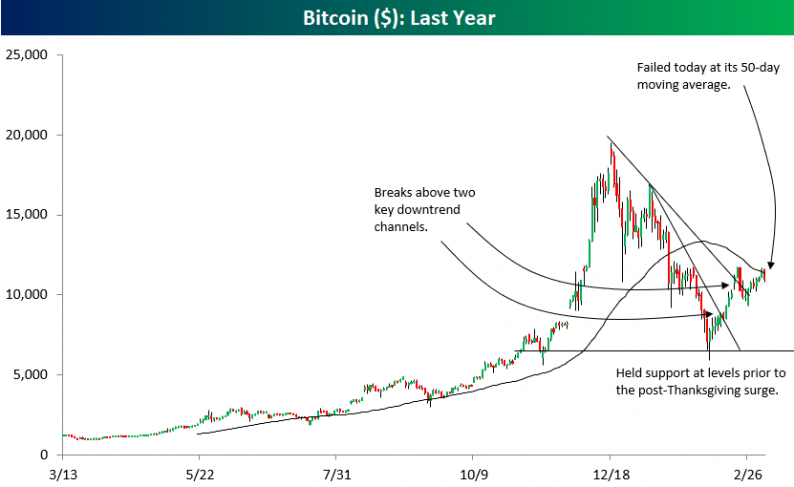
We’ve been highlighting the chart of Bitcoin below over the past month or so because of how much the crypto seems to be trading on technicals. After finding support around the $7,000 level in early February, Bitcoin bounced significantly and broke two key downtrend lines in the process. The reason we’re pointing out the chart today is because the rally has been stopped in its tracks right at the 50-day moving average. Bitcoin bulls were hoping that price could take out both the 50-day and the high from February 20th, which was just under the $12,000 mark. Instead, the 50-day (which sits right below $12,000) acted as stiff resistance and we’ve seen price pull back to the $11,000 mark.


Leave A Comment