Technical analysis on bitcoin is often hard as the cryptocurrency just breaks new records. Using Fibonacci and other technical tools to estimate the next peak were not that fruitful.
But as the coin becomes more mainstream and trading volume rises, there are also quite a few ups and downs which make it somewhat easier to analyze. The beginning of futures trading in the CME exchange this week alongside the inclusion of bitcoin cash (BCH) in Coinbase meant that trading was choppier and without new records.
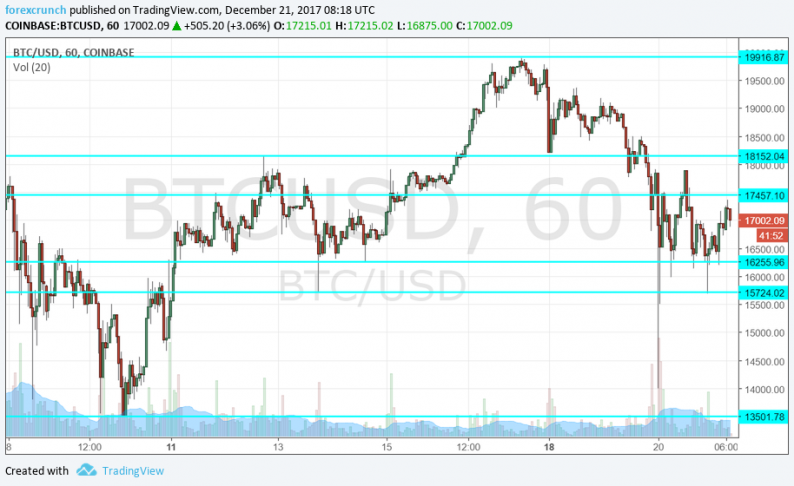
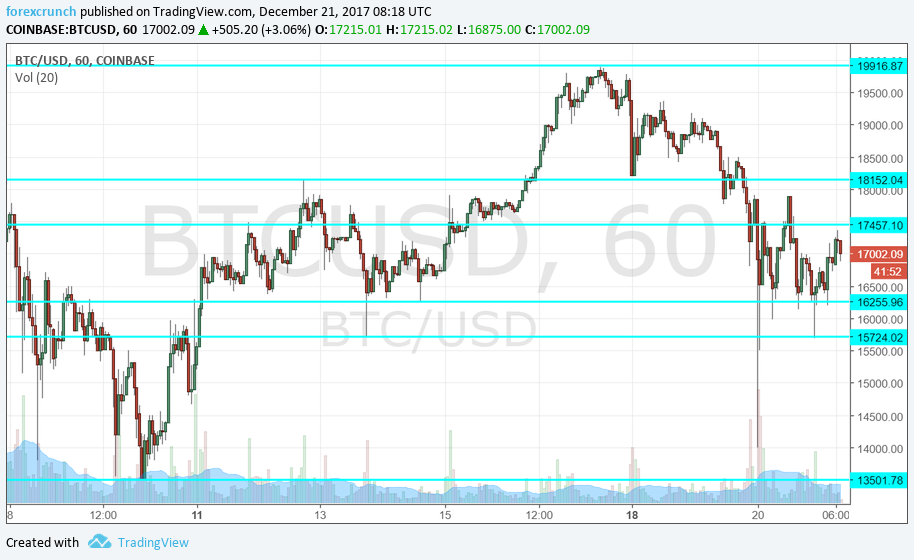
So what do the charts tell us? We can see a downtrend since the beginning of the week: the high point of $19,916 was a big break but from there every move is to the downside, with lower highs along the way.
$18,152 was a line of resistance on the way up last week and then served as support on the way down. Another lower high worth mentioning is $17,457. This level was a cap on the way up and is the latest lower high.
Yet the downside is also limited by support levels that are not too far away: $16,255 was already a support level on the way up and it is backed up by a weaker cushion at $15,725.
Should bitcoin totally crash, $13,500 seems like a line in the sand. On the topside, $20,000 remains a big line, even though it isn’t in the sky anymore.
Here is the chart:


Leave A Comment