
Online Trading Academy Article of the Week
by Sam Evans, Online Trading Academy
In the world of conventional Technical Analysis, there are many different approaches ranging from basic candlestick patterns to a variety of technical indicators, most of which tend to give very lagging signals to buy and sell.

As I have explored in previous articles, if used in the correct manner, namely alongside quality price action analysis, these tools can prove useful but only if we respect that nothing will ever give us a better signal to buy or sell than price itself. As you know, here at Online Trading Academy we focus our trading around Institutional levels of Supply and Demand first and foremost. If you can spot the imbalances between the buyers and the sellers with an objective approach, then you will start to find many low risk and high reward trading opportunities across the global Forex markets.
However, an understanding of some of the more classic charting approaches can be beneficial from time to time, especially if you don’t use these methods in the traditional manner. Take charting patterns for example, like the double top, head and shoulders and wedge. All said patterns repeatedly form in the market on a regular basis and can be powerful representations of price, but only if we use them in a logical manner. Let’s explore the Head and Shoulders pattern in more detail.
A little while ago I was looking at GBPUSD pairing which had been in a decent upwards trend and was beginning to lose its momentum, showing signs of weakness. In fact, according to my own analysis it was staring to form a potential head and shoulders top, meaning it may be about to break down into a downwards trend shortly. Here is what the chart looked like at the time:
Click on image to enalrge
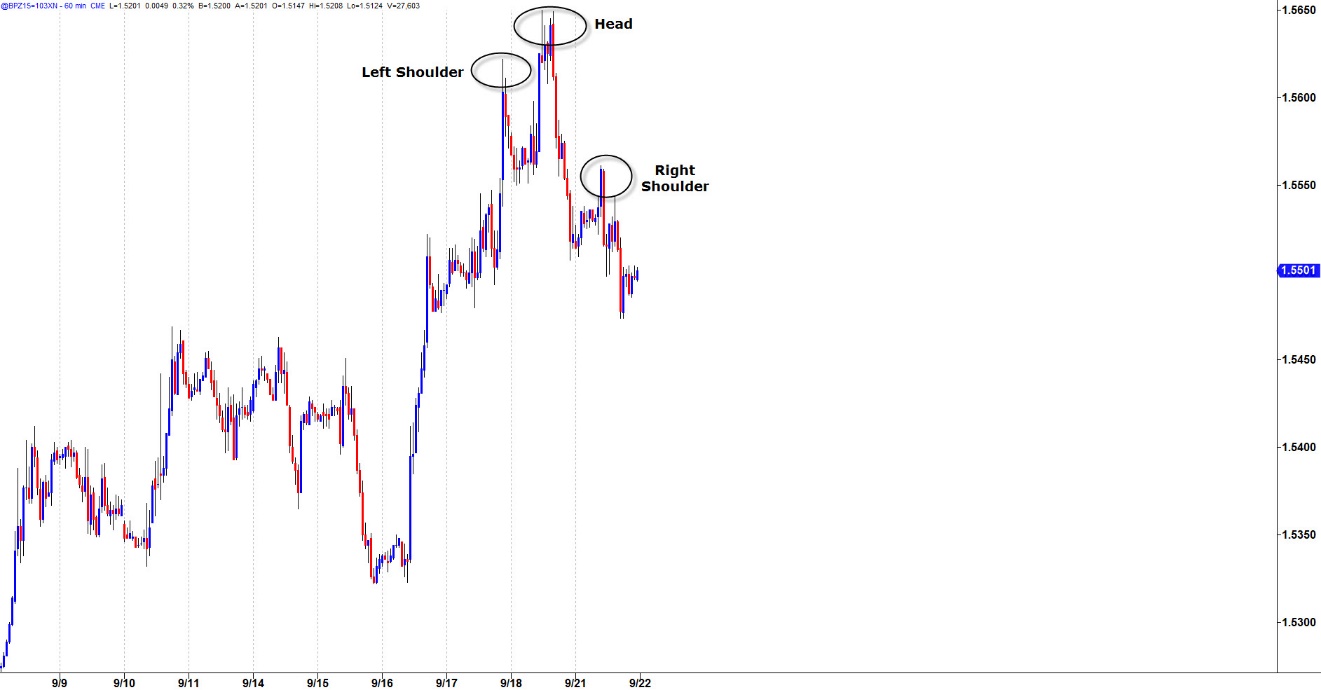
Now, I know what some of you may be thinking here: “That’s not the cleanest looking head and shoulders!” Well I would agree, but I discovered very early on in my career that the chart patterns rarely look as nice in real life as they do in the textbooks. More importantly, the pattern was shaping up and weakness was being suggested. Now, using the pattern in the classic sense means we would expect a breakdown of the “neckline” area and a continuation of the downward move. This neckline and projected target can be measured in the following way:


Leave A Comment