
The headlines say construction spending improved this month – Econintersect sees the data moving around to the extent it would be wrong to take this month’s data to the bank (and because last month’s data was revised up, we see a deceleration this month in growth). The weakness over the last few months continues to be attributable to softness in the rate of growth of private sector construction.

The backward revision this month again were generally moderate and downward – and the growth this month would have been worse except due to this backward revision decline. The 3 month rolling average of year-over-year growth continues to decelerate.
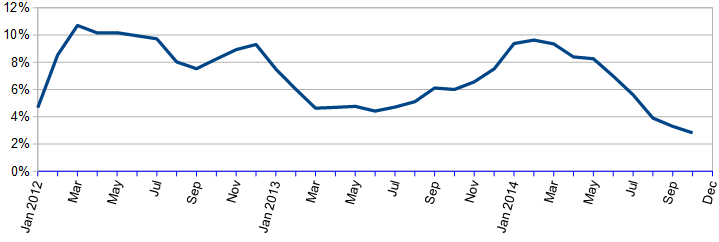
Econintersect analysis:
Unadjusted Construction Spending – Three Month Rolling Average Compared to the Rolling Average One Year Ago
US Census Analysis:
Construction spending (unadjusted data) was declining year-over-year for 48 straight months until November 2011. That was almost four years of headwinds for GDP. Construction spending is now in the fifteenth month of year-over-year spending expansion (unadjusted data), and the average rate of growth in the last 12 months had been over 5% – and this month the growth continues below that average.
Indexed and Seasonally Adjusted Total Construction Spending (blue line) and Inflation Adjusted (red line)


Leave A Comment