Starting in September of 2014, I analyzed every Dividend Aristocrat stock in detail. You can see the results of the analysis at this link.
It has been just over a year since that time. The S&P 500 has been turbulent since September of 2014. Oil prices have crashed. The global economy is threatening to stall.
A full 4 quarters have passed since the last Dividend Aristocrats analysis. It is time to analyze all 52 current Dividend Aristocrats again.
Last year, the Dividend Aristocrats series started with Stanley Black & Decker (SWK). We will start the analysis off this year with Stanley Black & Decker as well.
Business Overview
Stanley Black & Decker is a diversified industrial goods manufacturer with a $15.3 billion market cap. The company was founded in 1843 in Connecticut.
Stanley Black & Decker has paid dividends for 139 years – and increasing dividends for 48 consecutive years. The company’s dividend streak is nothing short of amazing.
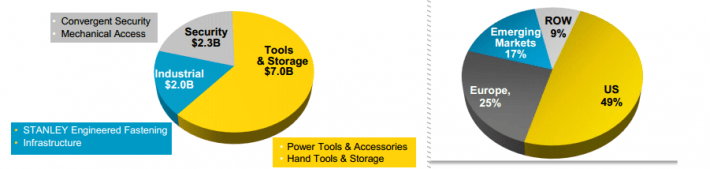
The company operates in 3 segments:
Geographically, Stanley Black & Decker’s revenue breaks down as follows:
The image below shows the company’s revenue breakdown graphically.

Competitive Advantage
Stanley Black & Decker has paid increasing dividends for 48 consecutive years. That simply does not happen without a strong competitive advantage.
All 3 of the company’s segments are either #1 or #2 in their industry. This is a result of the company’s strong brands – especially the Stanley brand.

In brand-based, highly competitive industries like packaged food products, companies regularly spend 5% to 10% of revenue on advertising. Stanley Black & Decker has built its brands with significantly less advertising spend. The company has spent around $120 million a year in each of its last 3 years on advertising. This comes to around just 1.1% of revenue spent on advertising.


Leave A Comment