
This coming week, the Federal Reserve’s Open Market (Operations) Committee will decide whether or not to impose another interest rate increase. The FOMC has already put four quarter-point hikes in place since late 2015, largely to preemptively keep inflation tame… though it’s not clear they were absolutely necessary (although they didn’t hurt matters either). But, the pros suspect another quarter-point increase is in the cards with Wednesday’s report. In fact, the pros – and traders – say there’s a 95% chance we’ll see a 25 basis point rise in the nation’s base interest rate.
It begs the question though: What does the interest rate picture look like down the road? And, how are the estimates determined anyway? We’ve got an answer for both.
Many financial research firms, banks and investment outfits offer their prognostications, sometimes as a publicity tool, and other times because they have a vested interest in the interest rate backdrop. Sometimes those opinions are aggregated and shared, often without attribution.
That’s not the only means of deducing what sort of interest rate changes are in the queue though. Another way, and arguably a better way, is by taking a look at the open interest and trading activity in the futures that allow traders to place bets on the Federal Reserve’s most watched interest rate. Yep, there’s trading in pretty much everything these days. It’s this data, in fact, that we’re most interested in as an interest rate barometer, since this is an indication of trades that real people have place with real money. The raw data and some helpful visualizations of the information are accessible from the CME’s FedWatch page.
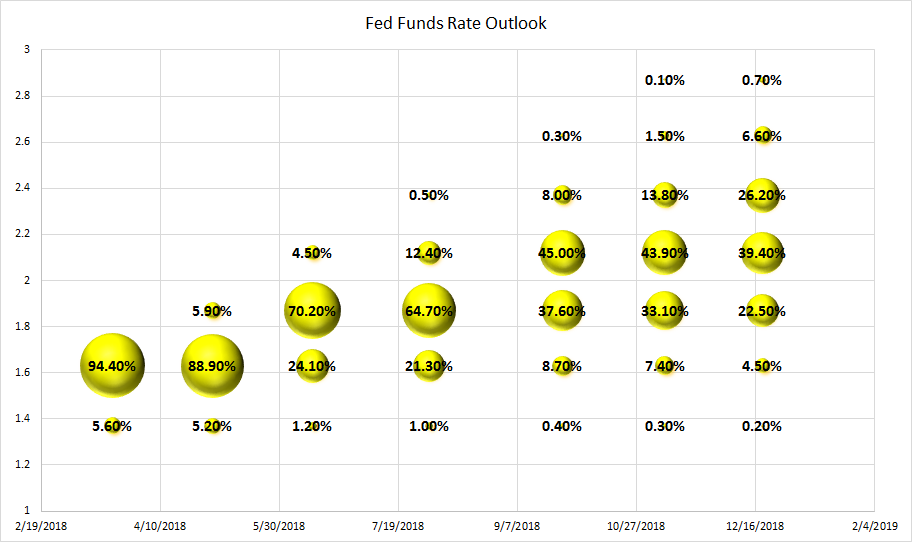
Or, you can just take a look at our graphic below, which we feel is the easiest and most meaningful graphical representation of what’s in the cards.
Take a look. From left to right is the timeframe for all the potential interest rate changes the Fed could put in place through the end of 2018; there are only eight normally-scheduled instances where rates can be raised or lowered. From top to bottom is the target rate the Fed aims at. It’s around 1.37% right now (which isn’t represented on the chart), but after Wednesday’s announcement next week most traders think the target rate will be around 1.63%… a range between 1.5% and 1.75%. [Click the image to see the full-sized version.]


Leave A Comment