The Department of Energy’s Energy Information Administration (EIA) monthly data on volume sales is several weeks old when it released. The latest numbers, through mid-June are now available. However, despite the lag, this report offers an interesting perspective on fascinating aspects of the US economy. Gasoline prices and increases in fuel efficiency are important factors, but there are also some significant demographic and cultural dynamics in this data series.
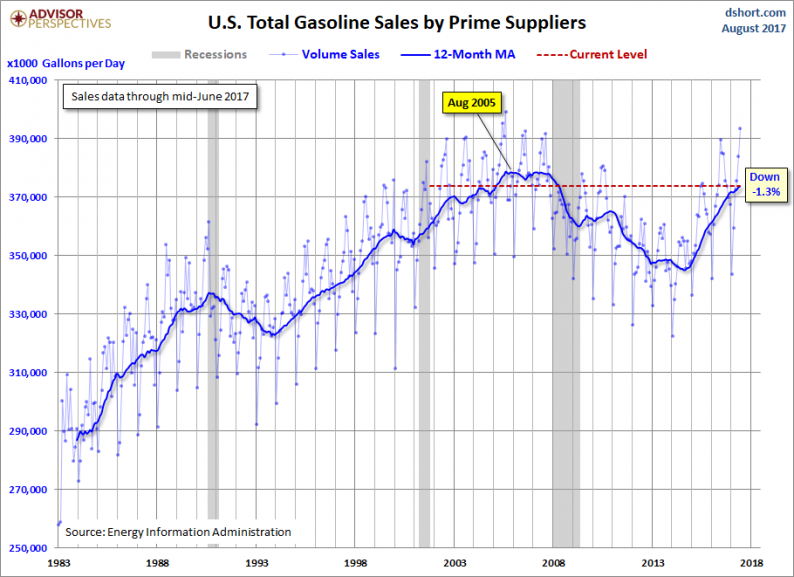
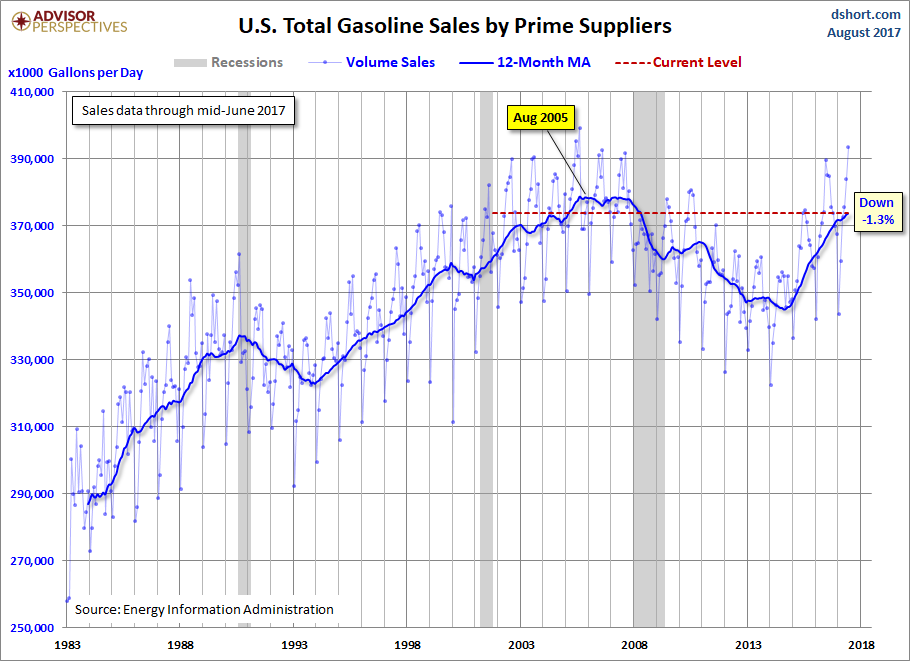
Because the sales data are highly volatile with some obvious seasonality, we’ve added a 12-month moving average (MA) to give a clearer indication of the long-term trends. The latest 12-month MA is 1.3% below its all-time high set in August 2005 and well off its -8.9% interim low set in August 2014.
The next chart includes an overlay of real monthly retail gasoline prices, all grades and formulations, adjusted for inflation using the Consumer Price Index (the red line). We’ve shortened the timeline to start with EIA price series, which dates from August 1990. The retail prices are updated weekly, so the price series is the more current of the two.
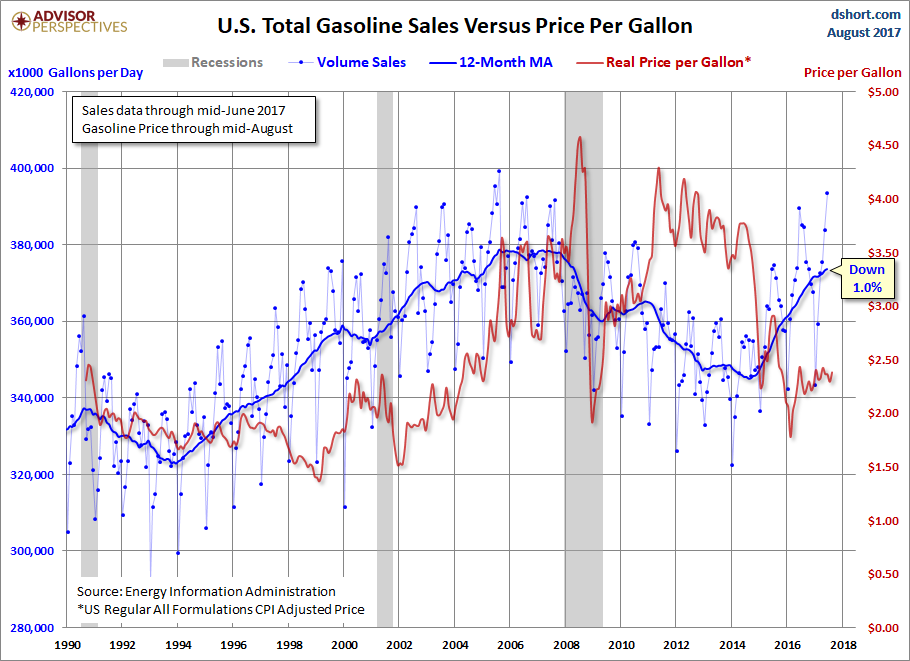
As we would expect, the rapid rise in gasoline prices in 2008 was accompanied by a significant drop in sales volume. With the official end of the recession in June 2009, sales reversed direction. The 12-month MA hit an interim high in November 2010 and then resumed contraction. Since September of 2014, sales have been on the rise, most likely due to the drop in gasoline prices. The moving average for the latest month is 1.0% below the pre-recession level.
Some of the past shrinkages in sales can be attributed to more fuel-efficient cars. But that presumably would be relatively small over shorter time frames and would be offset to some extent by population growth. For some specifics on fuel efficiency, see the Eco-Driving Index for new vehicles developed by the University of Michigan Transportation Research Institute. However, if we look at Edmunds.com for data on the top 10 best-selling vehicles, energy efficiency doesn’t seem to be the key decision factor, to judge from the percentage of pickup trucks and of SUVs.


Leave A Comment